
May 2023 Report
Slow and Steady
Not much has changed from March to April. There has been some inventory accumulation, but the pace of sales and new listings hasn’t really changed at all, which is why some inventory has accumulated.
Sign up for our monthly newsletter below.


Lake Las Vegas by the Numbers
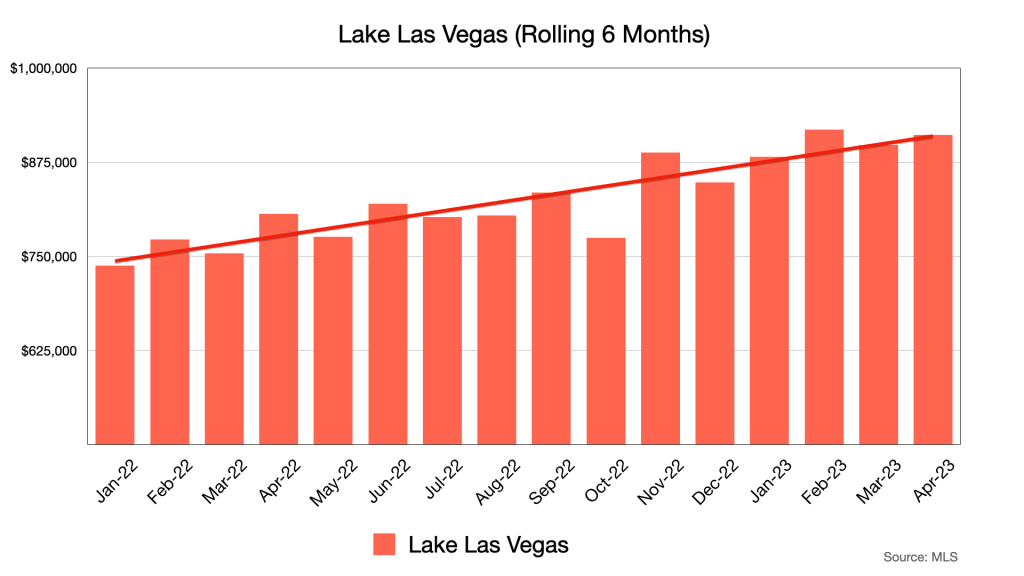
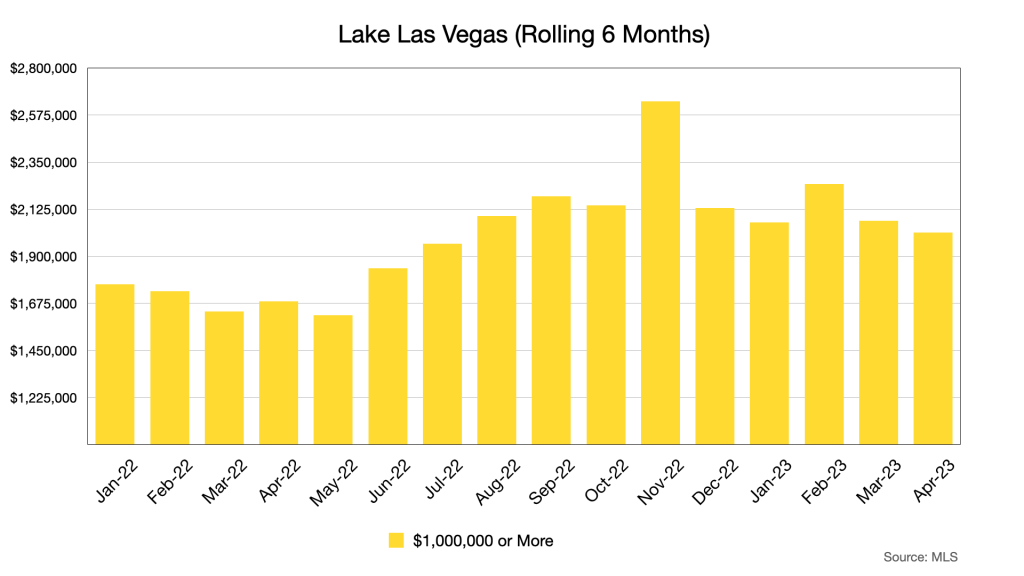
This represents all of Lake Las Vegas, properties on a rolling six month average so that we can see the trend through the month-to-month noise. The trend is still up. The thing to keep in mind here is that Lake Las Vegas has a wide range of homes that sell for a wide range of price ranges.
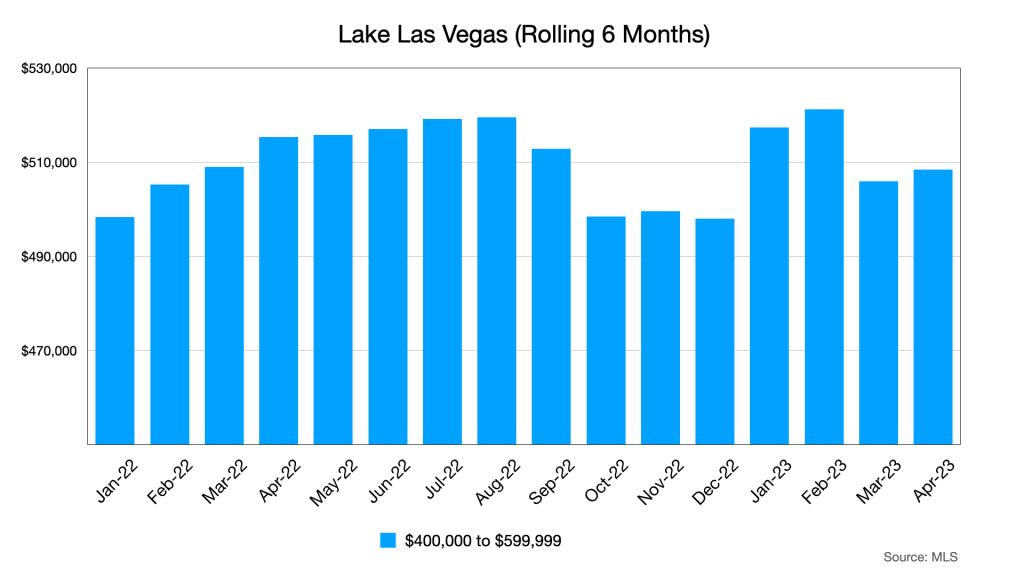
This is the same chart as above but isolated to the $400,000 to $599,999 price range. Notice the dip starting in September 2022. This is about how long it took for the interest rate hikes of that era to affect the local market. In this price range, conventional loans are more approachable to most buyers.
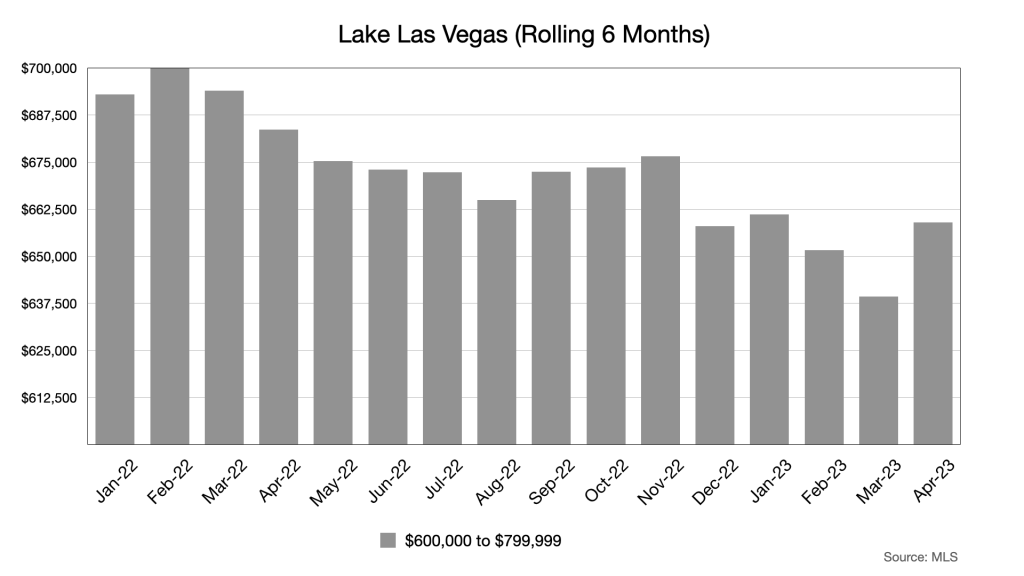
Same chart still, but now we’re looking at the $600,000 to $799,999 price band. The downward trend from September never really corrected all that much, like it did in the $400K-$599K chart above, but there was a nice uptick in April 2023. Conventional loans are still an option for this category, though they are most useful at the bottom of the band due to the max conforming loan limit.
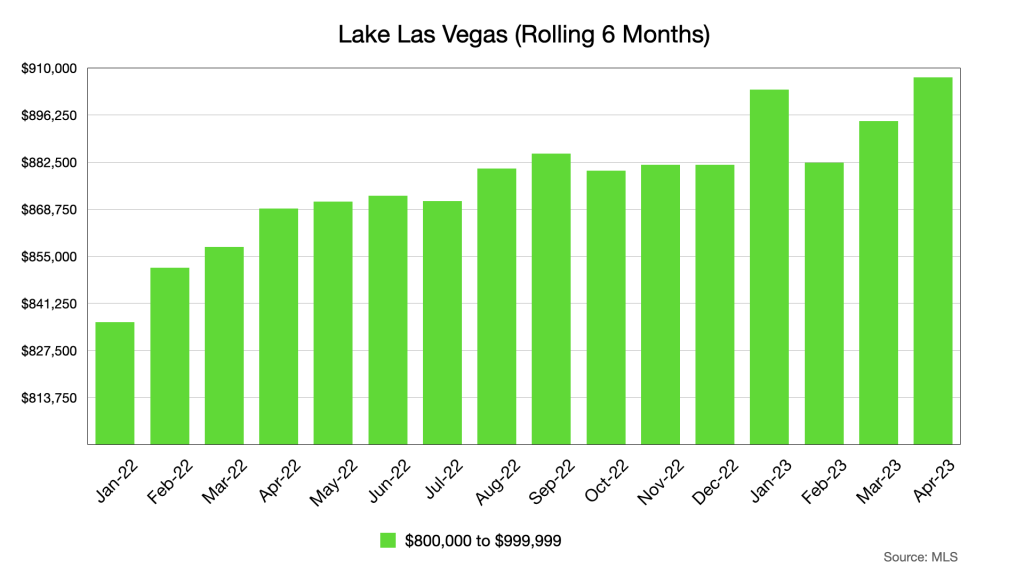
Now we’re into the $800K-$999K band. I’ll first point out that there aren’t as many sales in this price band as compared to the previous bands. That said, there is certainly enough data here to show a clear trend. We’re now looking at buyers who are able to weather short to medium term interest rate hikes or put out enough cash not have to worry about loan payments.
This is the million plus category. I’ll add the same caveat as I did above. This chart doesn’t represent a huge sample of the sales in Lake Las Vegas, but there is still plenty of data. The two bands that represent the $800K to $1MM+ price range obviously have little correlation to interest rates, in fact there may be some long term investment shown in these bands due to the volatility of other types of assets like stocks and bonds.
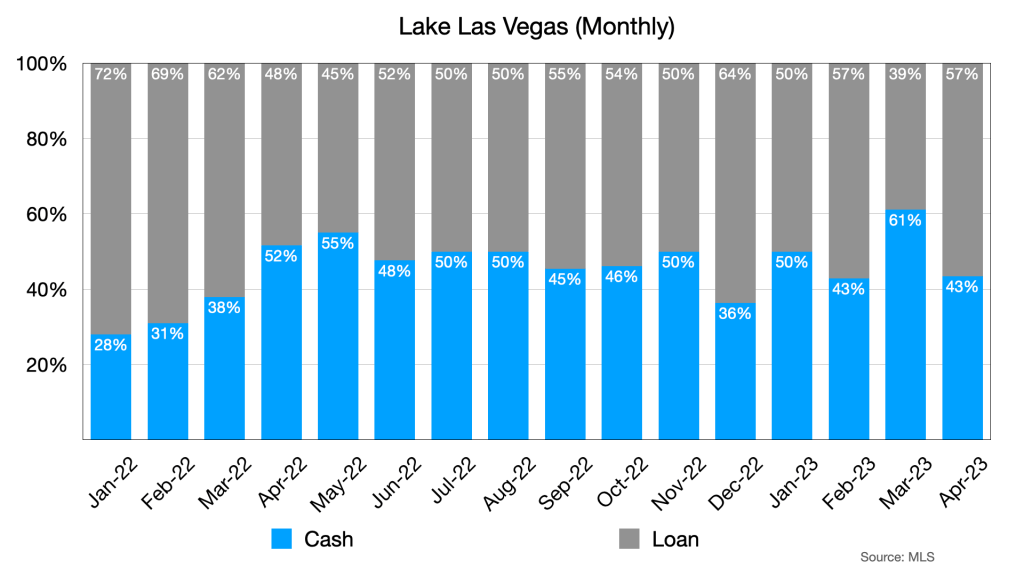
In the cash vs. loan breakdown, we can see another dip for cash, or if you prefer, another spike for loans. Here is an interesting correlation. Starting around March 1, 2023, mortgage purchase applications began to rise right around the time interest rates began to fall slightly. That spike in applications peaked around April 10th and then dropped a bit thereafter.
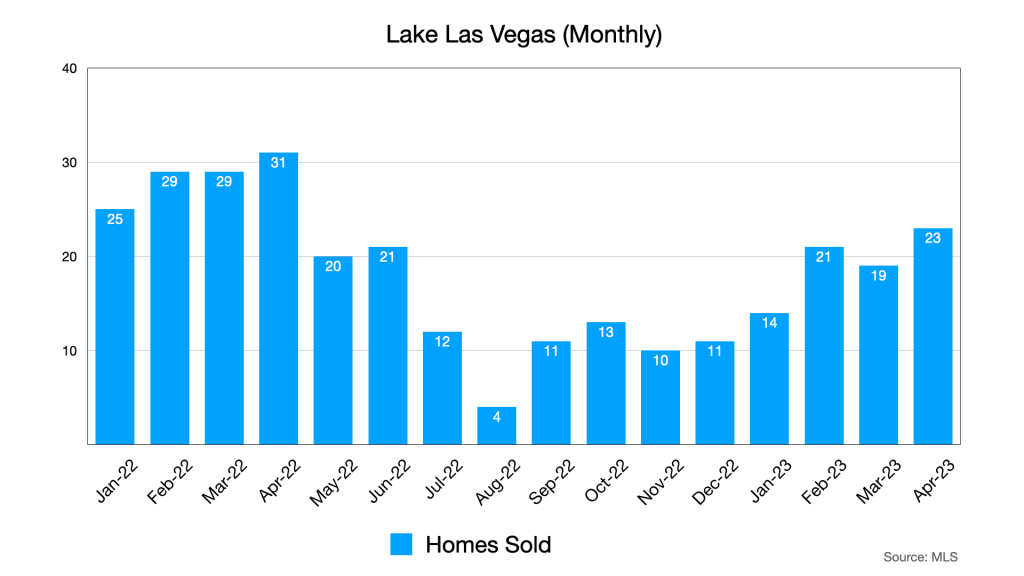
Homes sold remains in the low twenties for April. Nothing much has changed here, but we’re keeping our eye on it. A spike in sales would help shave off some of the accumulated inventory.
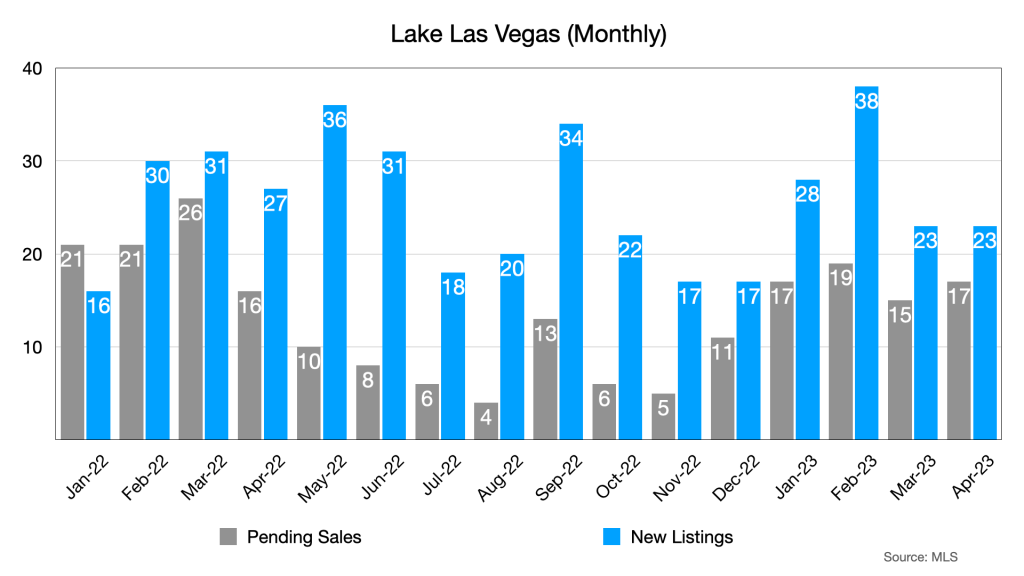
New listings and pending sales was also flat with new listings outpacing pending sales at about the same ratio as March. This is why we are accumulating inventory.
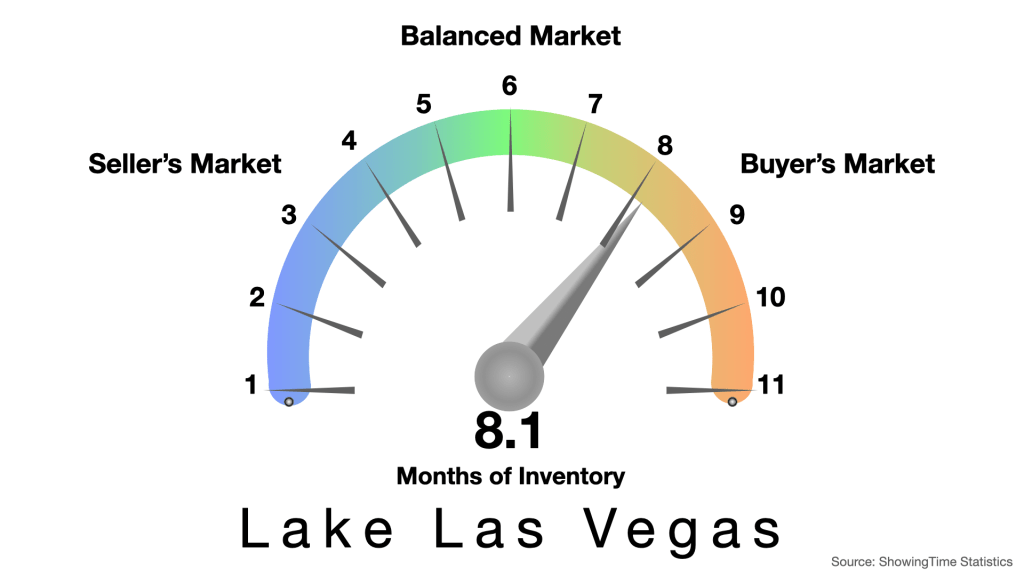
Inventory is at 8.1, up slightly from 7.9 months of inventory.
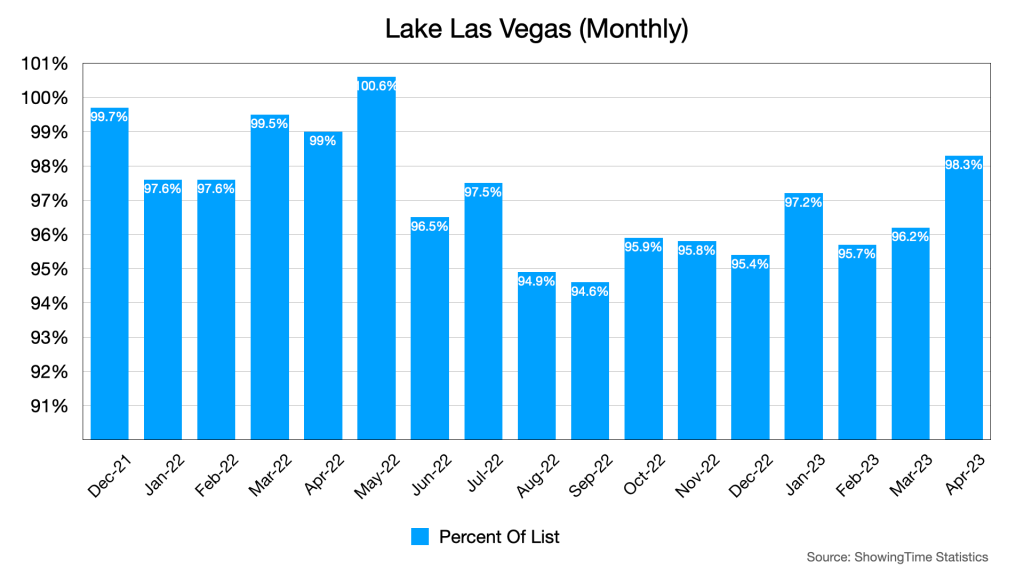
Once again, we see a nice uptick in the percent of list metric. As I’ve stated before, some of this might be the result of more informed list prices, but some of it is almost certainly buyer demand driven. Lake Las Vegas is comprised of many different and unique communities. Just because there is 8 months of inventory available doesn’t necessarily mean all of that inventory is competing with each other.
For more Lake Las Vegas real estate market data, click on the button below to access our dashboard.
Final Thoughts
There’s not that much to say that hasn’t already been said above. The top end of the market is seeing some price performance but overall, things are moving along at a modest pace.
We invite you to leave your thoughts in the comments below.
Thank you,
Robin & Dave
Sign up for our monthly newsletter below.
