
June 2023 Report
Upbeat Sales
May saw a nice uptick in total sales so some of the accumulated inventory was trimmed back. There’s a bit more to the story as you’ll see below.
I do make an attempt at analyzing price reduction trends but it is more complicated than it seems. The trend for this data is not clear and I don’t know that there is much to see here, but it is worth exploring.
Sign up for our monthly newsletter below.


Lake Las Vegas by the Numbers
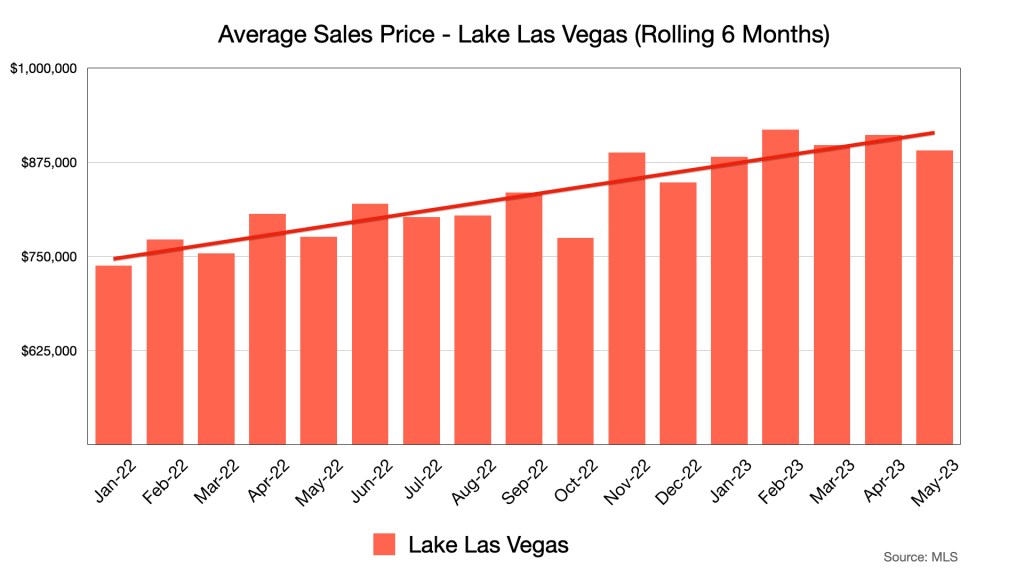
The upward price trend is holding with some normal variability.
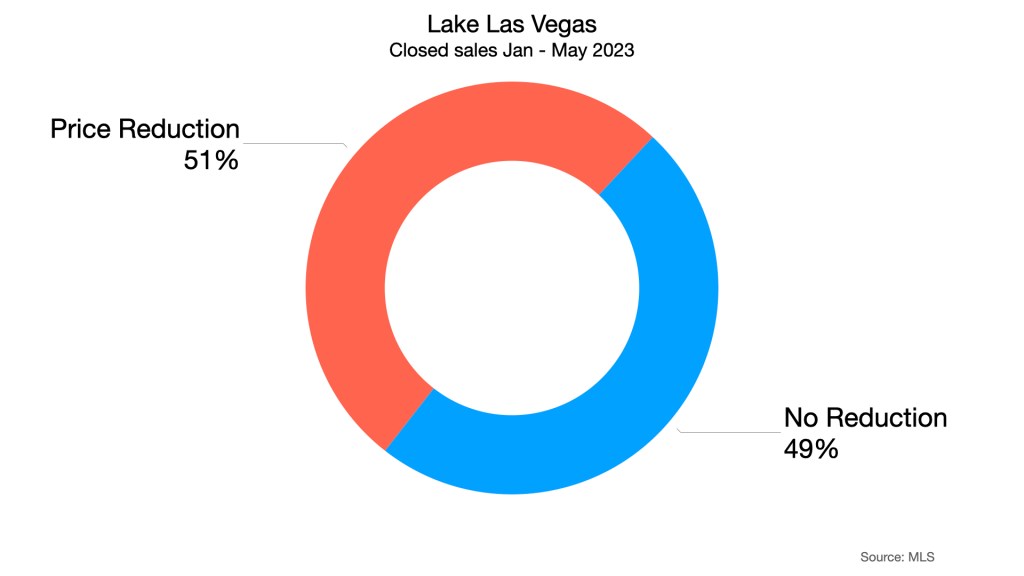
Anecdotally, we are still seeing price reductions come through our daily feed. This chart shows price reductions for homes that have closed since January 2023 to the end of May. Obviously, the prices were reduced while they were still active and analyzing exactly when they were reduced is a challenge with the available MLS data. The average reduction for these listings was -4%. Please keep in mind that price reductions are a normal part of the home selling strategy, so it is difficult to infer any sort of market shift here.
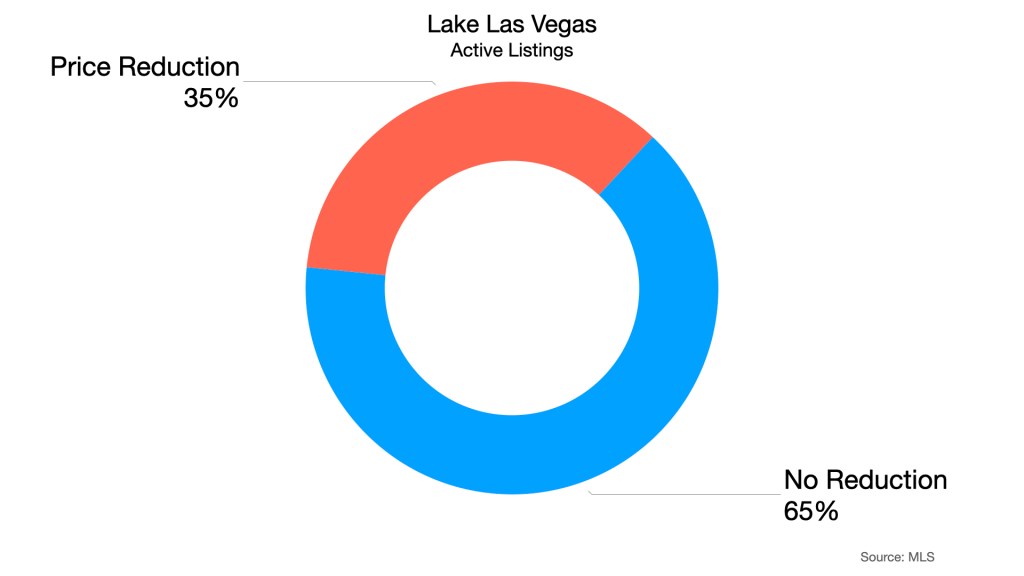
This is the same information, but for Active Listings. Some of these listings are younger than others so they may not yet have come to the price reduction crossroads. I prefer the data for the closed listings above, because it covers the entire lifecycle of the listing. And since they closed, we can safely assume they eventually discovered a price the market will bear.
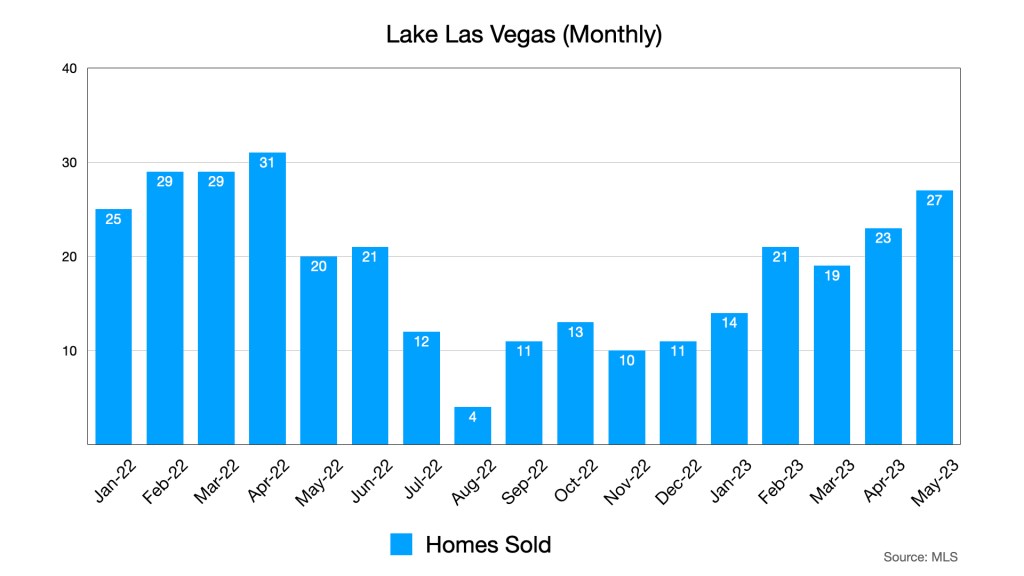
We are continuing our slow upward trend in monthly sales. We’re getting close to the highs of early 2022 which represents the time just prior to the shift in activity caused by sudden interest rate increases. Mortgage (purchase) applications had a slight decline starting in early May. But June is looking up so far.
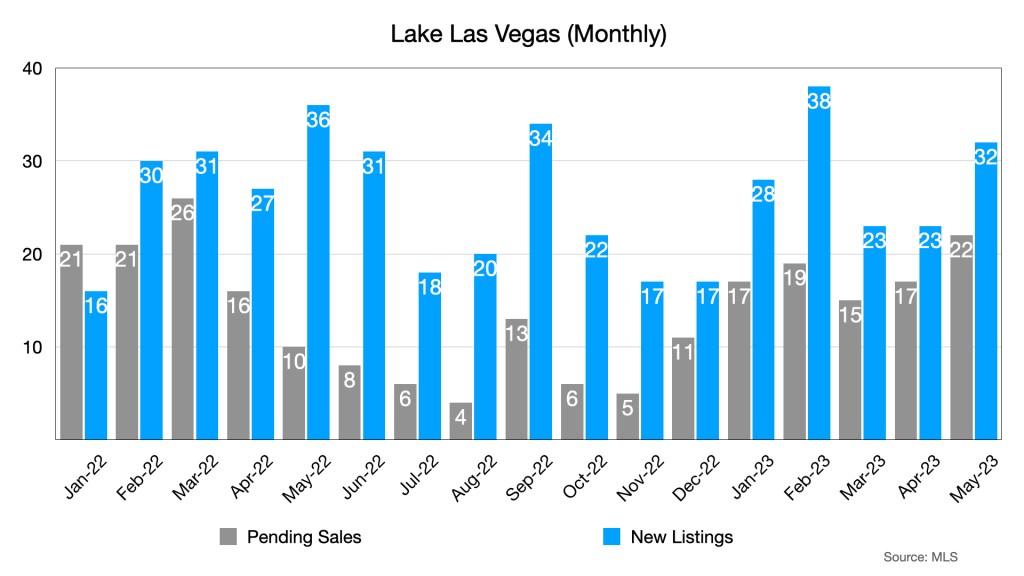
There was a bit of a jump in new listings in May, but also a slightly smaller jump in pending sales. The increase in sales seen above has helped reduce inventory, at least a bit.
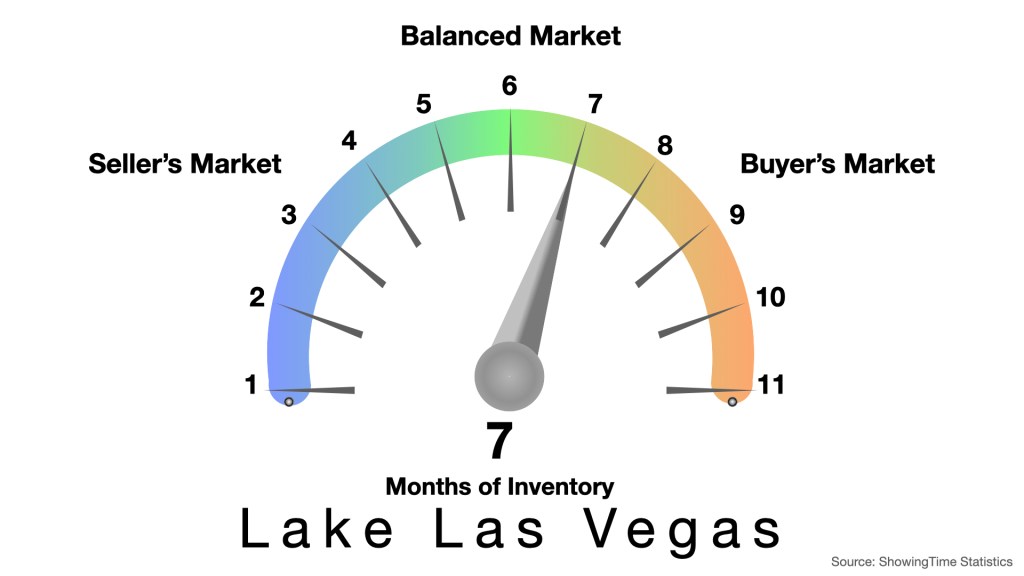
We were at 8.1 months in April, we’ve gone down to seven for may.
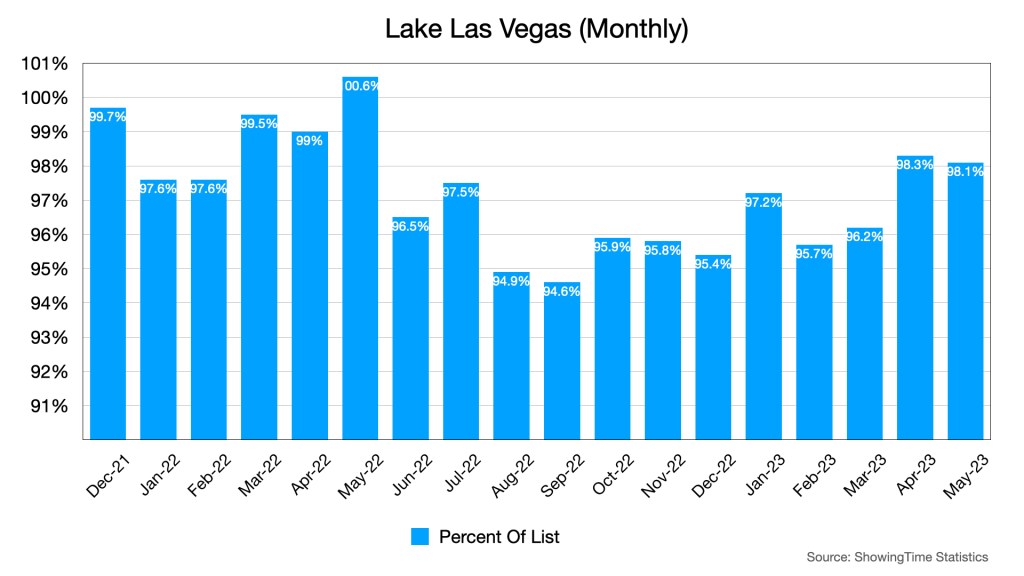
Sales prices are still holding tight to list price, but smart price reductions might have helped.
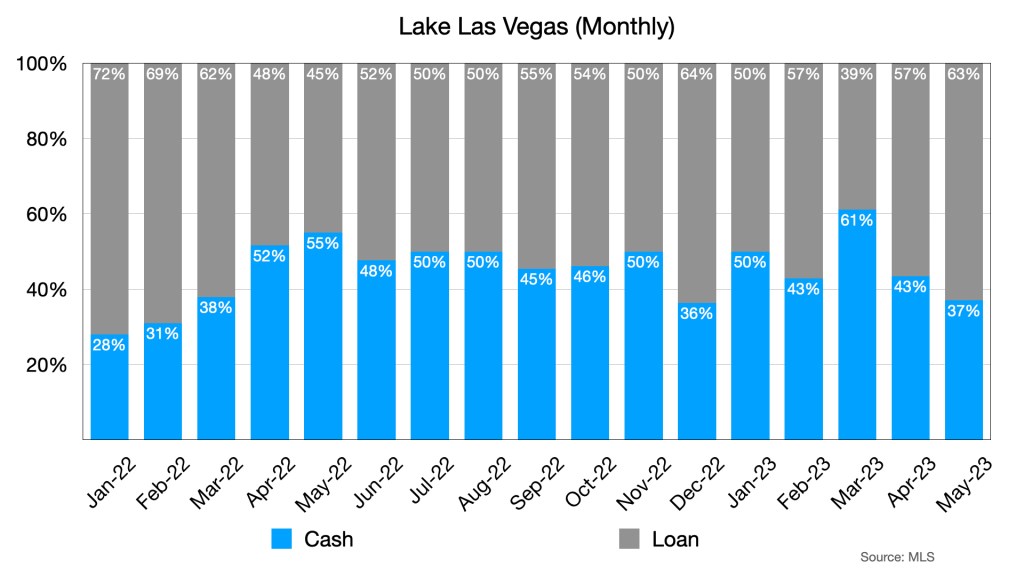
Loan purchases are up. April did see a small spike in mortgage (purchase) applications so we are probably seeing some of those applicants in this chart.
For more Lake Las Vegas real estate market data, click on the button below to access our dashboard.
Final Thoughts
Please, I beg you, don’t spend too much time contemplating the price reduction charts. They are interesting to explore, but also, more complicated than they look.
It was good to see an increase in sales that actually moved the needle on the month’s of inventory chart. It was also good to see that offer prices remained close to list for another month. Things are starting to look closer to a normal Lake Las Vegas market again.
We invite you to leave your thoughts in the comments below.
Thank you,
Robin & Dave
Sign up for our monthly newsletter below.
