
December 2023 Report
Balanced Activity
There was a slight decline in prices. We’ll analyze prices from the perspective of price bands to hopefully gain some insight into the underlying market dynamics in play. There was a bit of an inventory improvement but also a decline in sales. I think the sales decline and the listing decline balance each other.
Lake Las Vegas by the Numbers
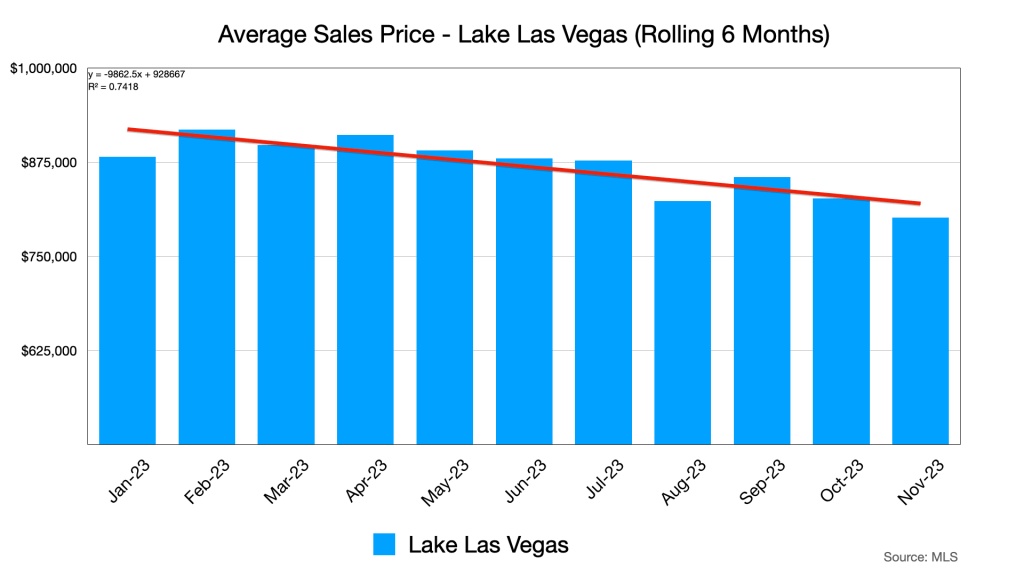
The price slowdown continues. Keep in mind that this chart includes all sales in Lake Las Vegas.

We’re going to break price performance down by these price bands so we might as well discuss how they are purchased a bit first. The cash heavy activity hits the top and bottom band more than the middle bands, but the story is a bit incomplete. The under $499k band attracts quite a lot of investor activity, especially smaller condos that fetch high rents, many investors pay cash. This price point is also more easily purchased with cash.
The million plus category fetches cash buyers because at this price point, a conventional loan will not cover the full purchase price and a Jumbo loan is just not something many buyers want to deal with.
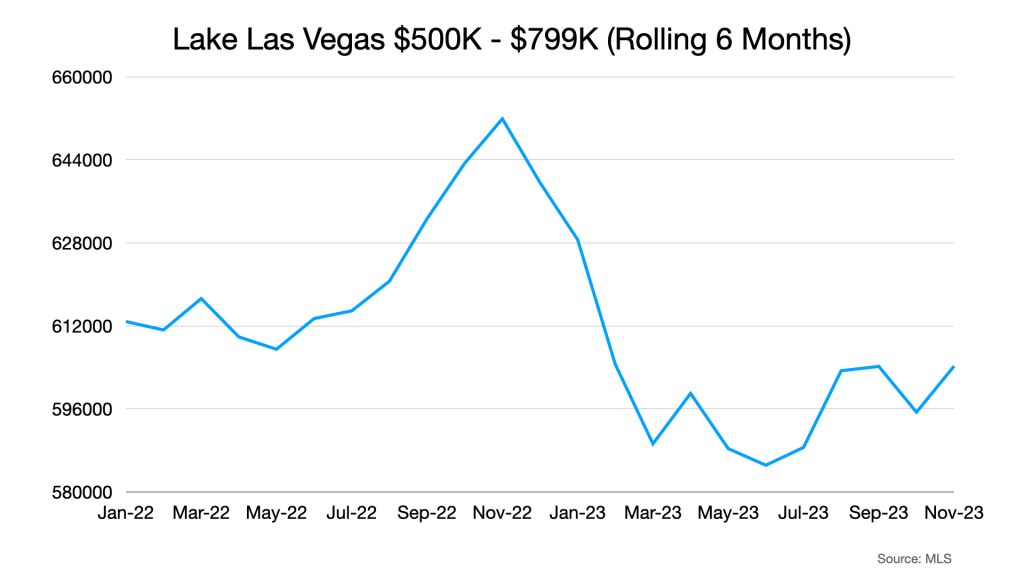
The $500k – $799k band is where most of the new home construction inventory is sold. The seller/builder can offer incentives to make the loans more affordable so people are less inclined to pay cash when they can get a rate buy down from the seller.
The $800k – $999k band is above the 2023 conforming loan limit of $726k so many borrowers will need to make a large down payment. Think north of 20% maybe even north of 50% in some cases. This added down payment often helps reduce the interest rate. I cannot consider someone who might be putting 50% down as a “cash” buyer, but they certainly need to have quite a sack of cash to finance a home in this band. Note that the 2024 conforming loan limit will be $766,550 so more homes in this price band may become approachable to borrowers next year.
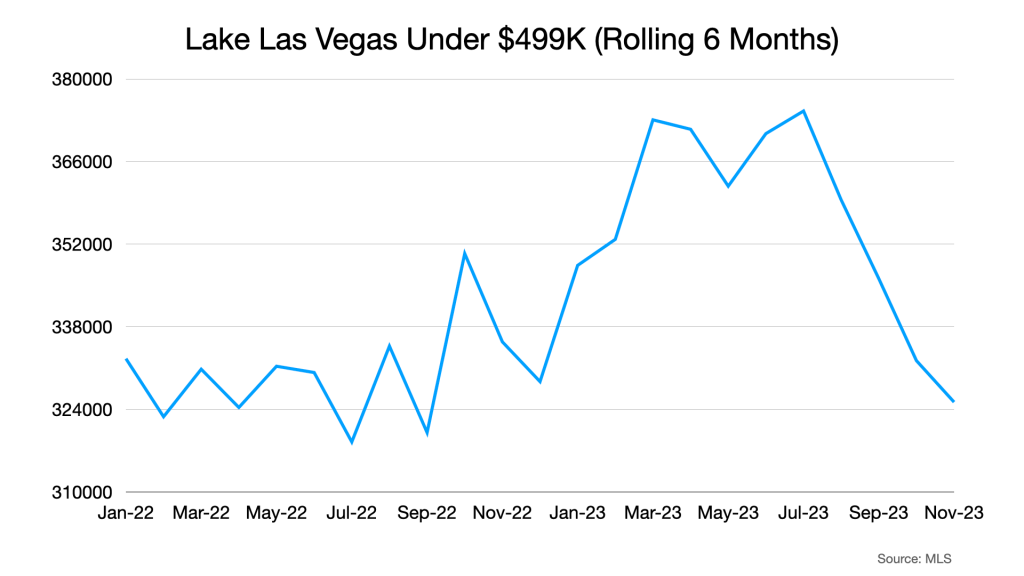
This chart represents all types of inventory in this price band. The steep drop towards the end was driven almost exclusively by condos.
Sign up for our monthly newsletter below.


This drop in prices was more uniform across Single Family, Condo and Townhome, but Condos did take the biggest hit. This price band, like the one before it would be more likely to be influenced by increased cost to borrow AKA interest rate hikes. Condos are especially difficult to finance due to their higher than average HOA dues since those dues become an expense lenders must consider for loan approval.
This price band shows a bit more resiliency to interest rate hikes. There is less inventory available in this price band and that probably contributed to the relatively smaller price dip shown here, but it also contributes to short term volatility. The volatility is an artifact of the limited inventory, not an indication of a wavering market. This market band is attractive to cash heavy buyers because these homes tend to fulfill many of their expectations in terms of size, bedrooms and location. Although these buyers may still take a loan to buy, they are willing and able to make a larger cash down payment to cover the difference between their maximum loan available and to reduce interest.
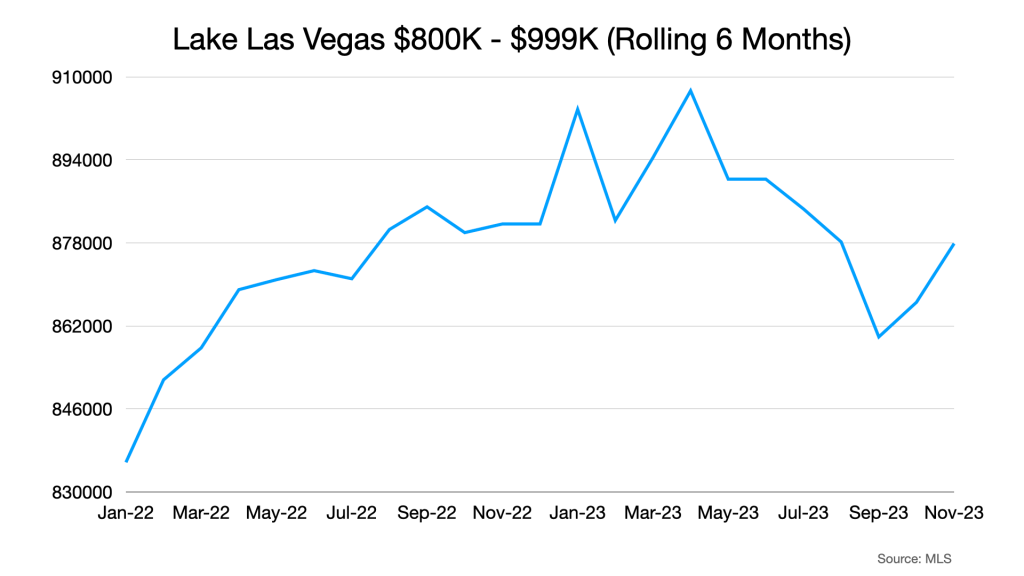
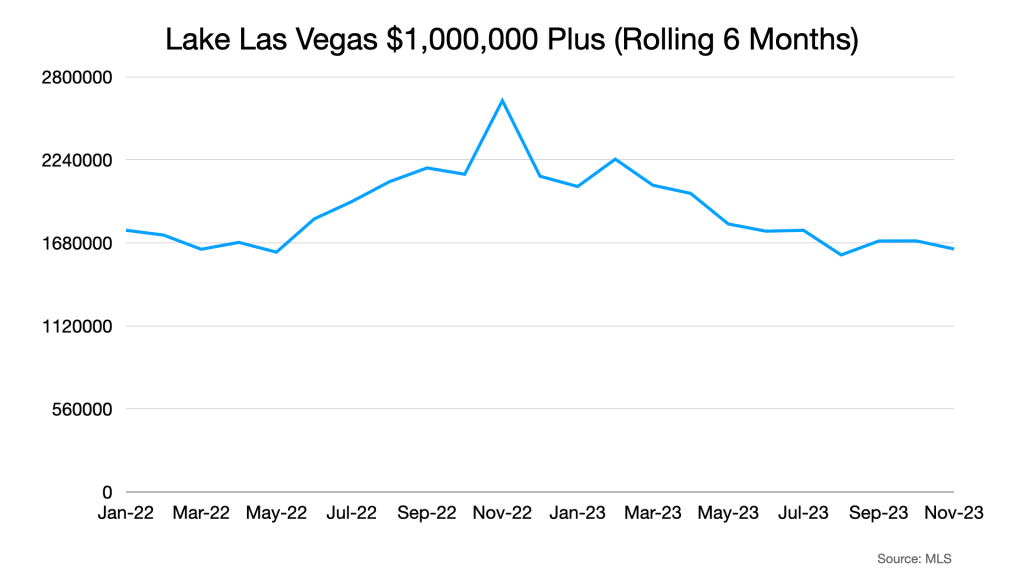
This price band is almost immune from the cost of lending (interest rates). Of course interest rate changes are reflections of other economic headwinds, but things like inflation, unemployment and such are more easily absorbed by buyers and sellers who own or buy in this price band. I would be reluctant to suggest any sort of trend is present in this chart. Sales happen slowly at this end due to the limited buyer pool. One or two big sales can throw off the chart for a month or two.
I think now would be a fine time to check in on a helpful indicator of buyer sentiment, the mortgage (purchase) application rate. After a spike in interest rates in the latter half of the year slowed and then dropped, mortgage applications perked up. This activity began around the first of November and has continued on into the early days of December. These applications will probably drive a bit of buying activity in the coming months and going into spring. You can follow this application data here: https://www.mortgagenewsdaily.com/data/mortgage-applications
Make sure to scroll down to the third chart in the link above for the “Purchase” applications.
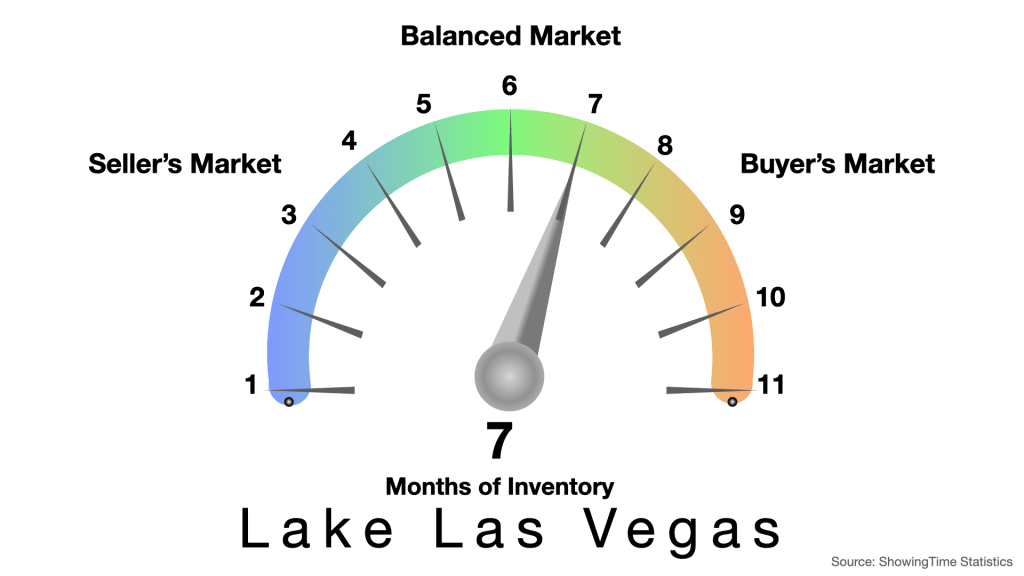
Last month inventory was at 7.7 months. We’ve come down a bit from that due to a slowing of listing activity and a slight uptick in pending sales. As noted in last month’s report, each area of Lake Las Vegas represents a different variety of homes, prices and inventory levels. This gauge represents all inventory. Some communities within Lake Las Vegas may outperform others so this is really just a broad reading on the health of the whole LLV market. We’re balanced. This is good. Buyers get an opportunity to negotiate while sellers know that limited inventory will protect the equity they’ve accumulated.
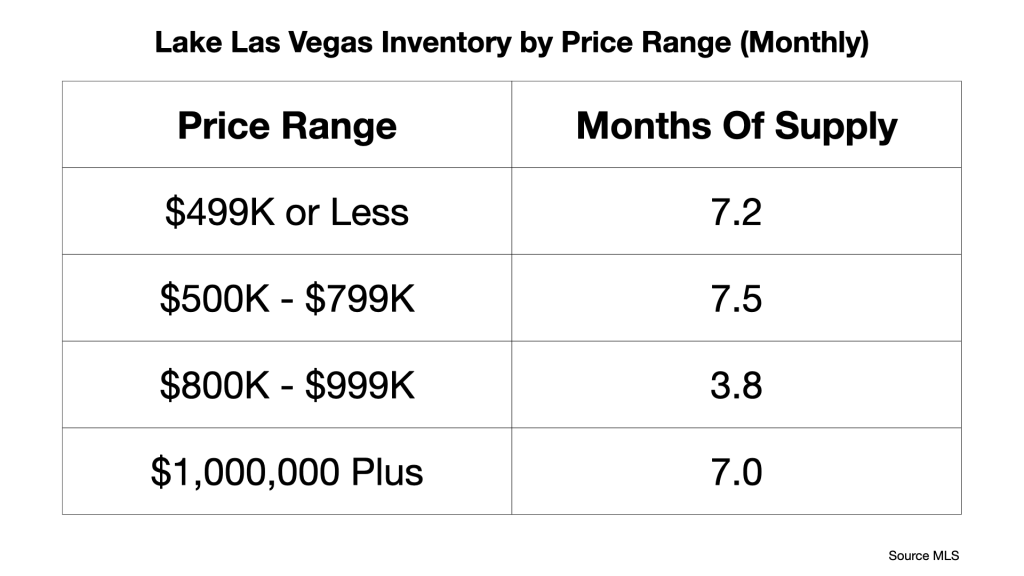
I’ve broken down the months of inventory by price band. The 7 months of inventory in the million plus band is more representative of the time it takes to sell a home in that price band than it is an indicator of available inventory. Remember, “Months of Supply” is a measure of how long it would take to sell all of the available inventory assuming no new inventory comes along, not how long it takes to sell one home.
The inventory in the $500k-$799k is a bit high due to the fact that there is so much builder inventory out there. I discussed this inventory in last month’s report.
The $800K-$999K inventory is lower than most due to its popularity among cash heavy purchasers (large cash downpayment with a loan or outright cash) and a general lack of inventory growth AKA listings.
There has been a reduction in sales since the peak in September. Much of this is normal seasonal market variation.
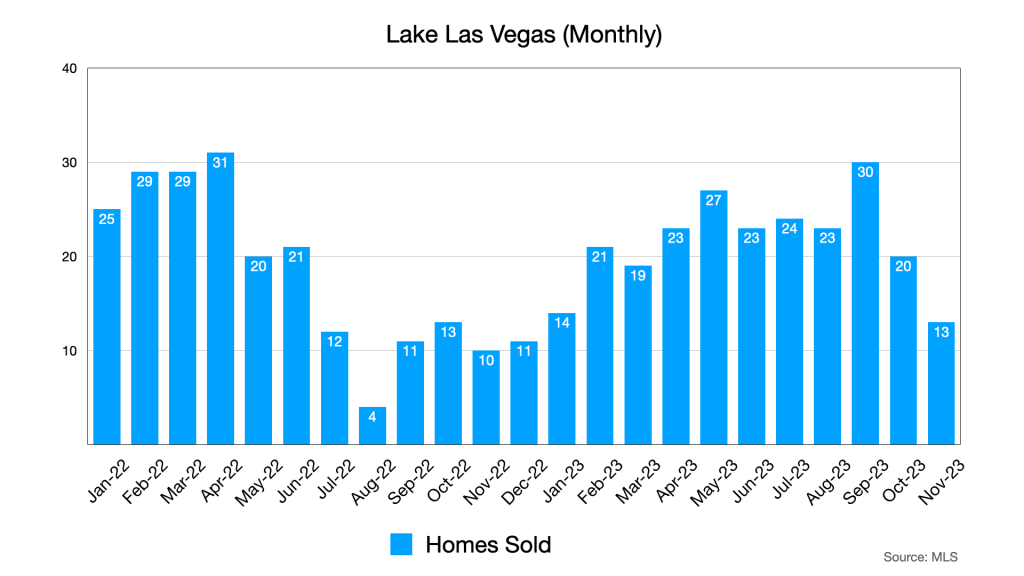
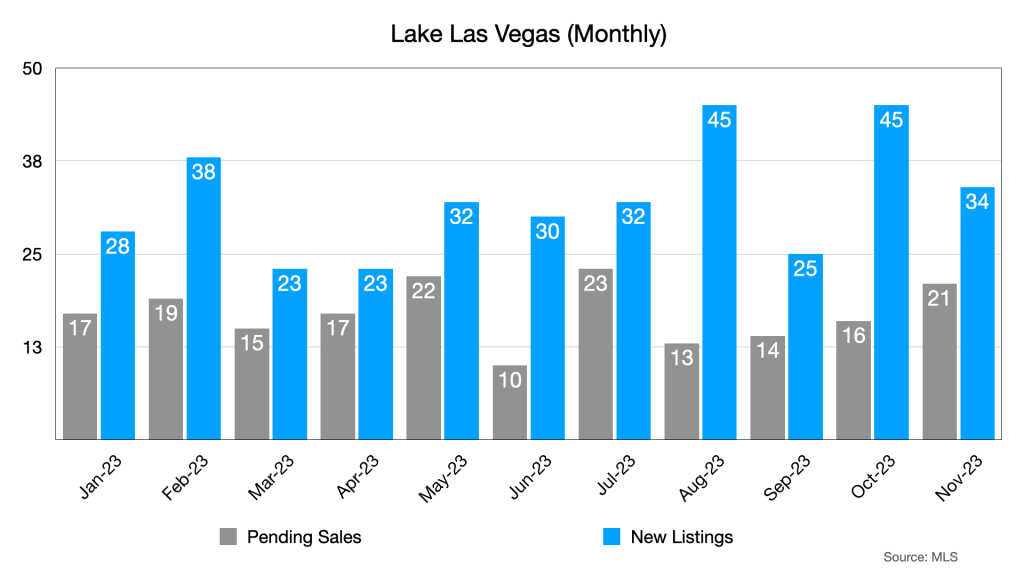
New listings are down from the prior month as well.
Final Thoughts
Different price bands perform differently and have their own inventory considerations. The higher price bands naturally attract cash buyers mostly due to the appeal of that available inventory to those that can afford to put out that much cash or make a larger down payment on a maxed out loan. The lower bands get cash buyers as well, but builder lending incentives are making that inventory competitive against resale inventory of the same price.
Listing activity has slowed a bit, but is still within the normal range and inventory has come down a bit too. As we head into the new year we may yet see some buyers come out now that they’ve had an opportunity to lock in a more favorable interest rate. We’ll keep our eyes open to see how this plays out.
Thank you,
Robin & Dave
Sign up for our monthly newsletter below.

One thought on “Lake Las Vegas Market Update”