Lake Las Vegas Market Update

A Deep Dive Into Understanding Home Values

Presented By: Robin & Dave

It’s been a while since our last Lake Las Vegas Market Report, but we’ve been busy upgrading our reporting system. Now, we can analyze the market in greater depth—spotting trends more easily and uncovering insights to help buyers and sellers make smarter decisions. In this update and in future updates, we’ll take a closer look at the data at a community level, starting with one of Lake Las Vegas’s most sought-after neighborhoods: Bella Fiore.

Before diving into the details, here’s a quick recap of the last few years.

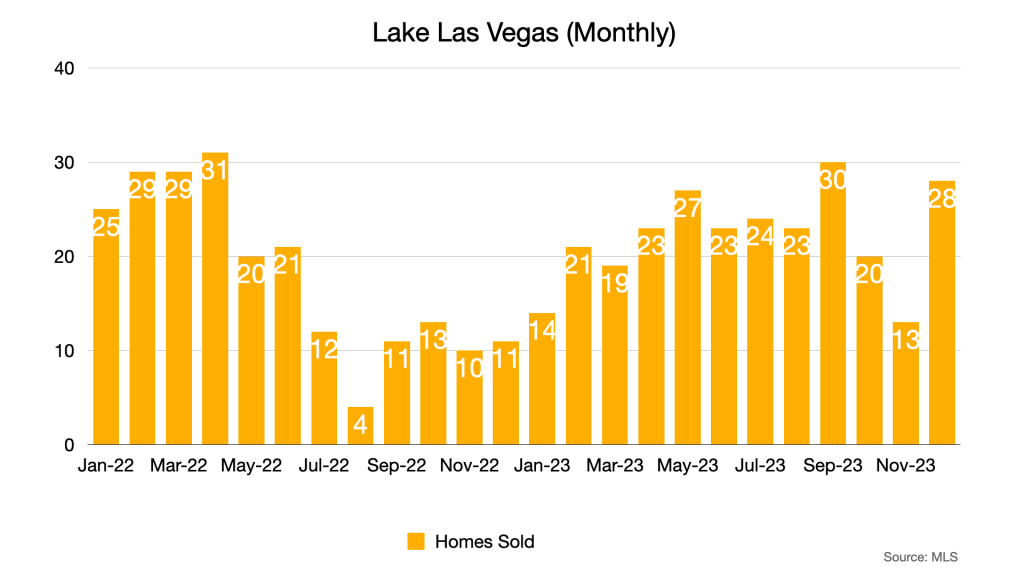
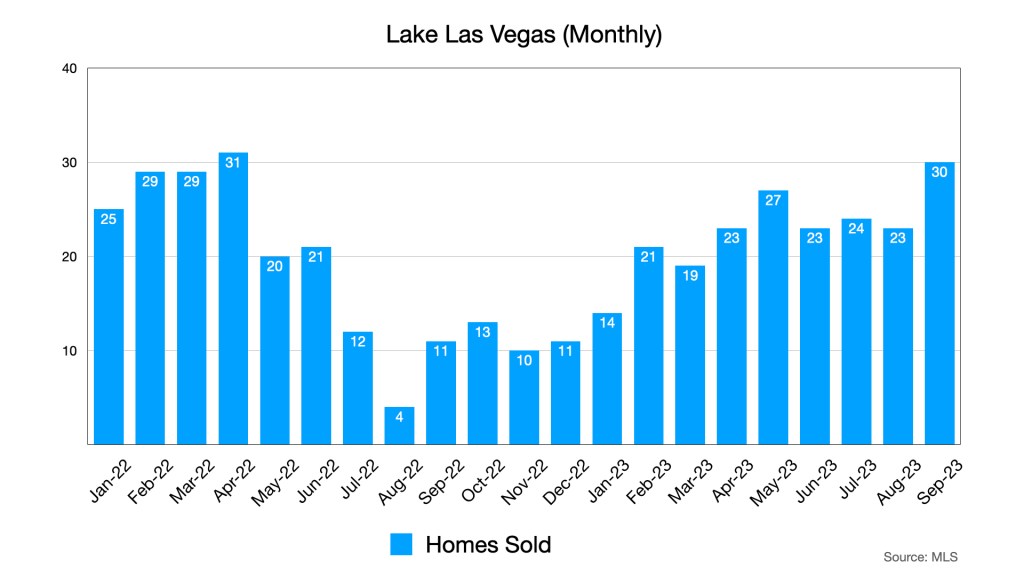
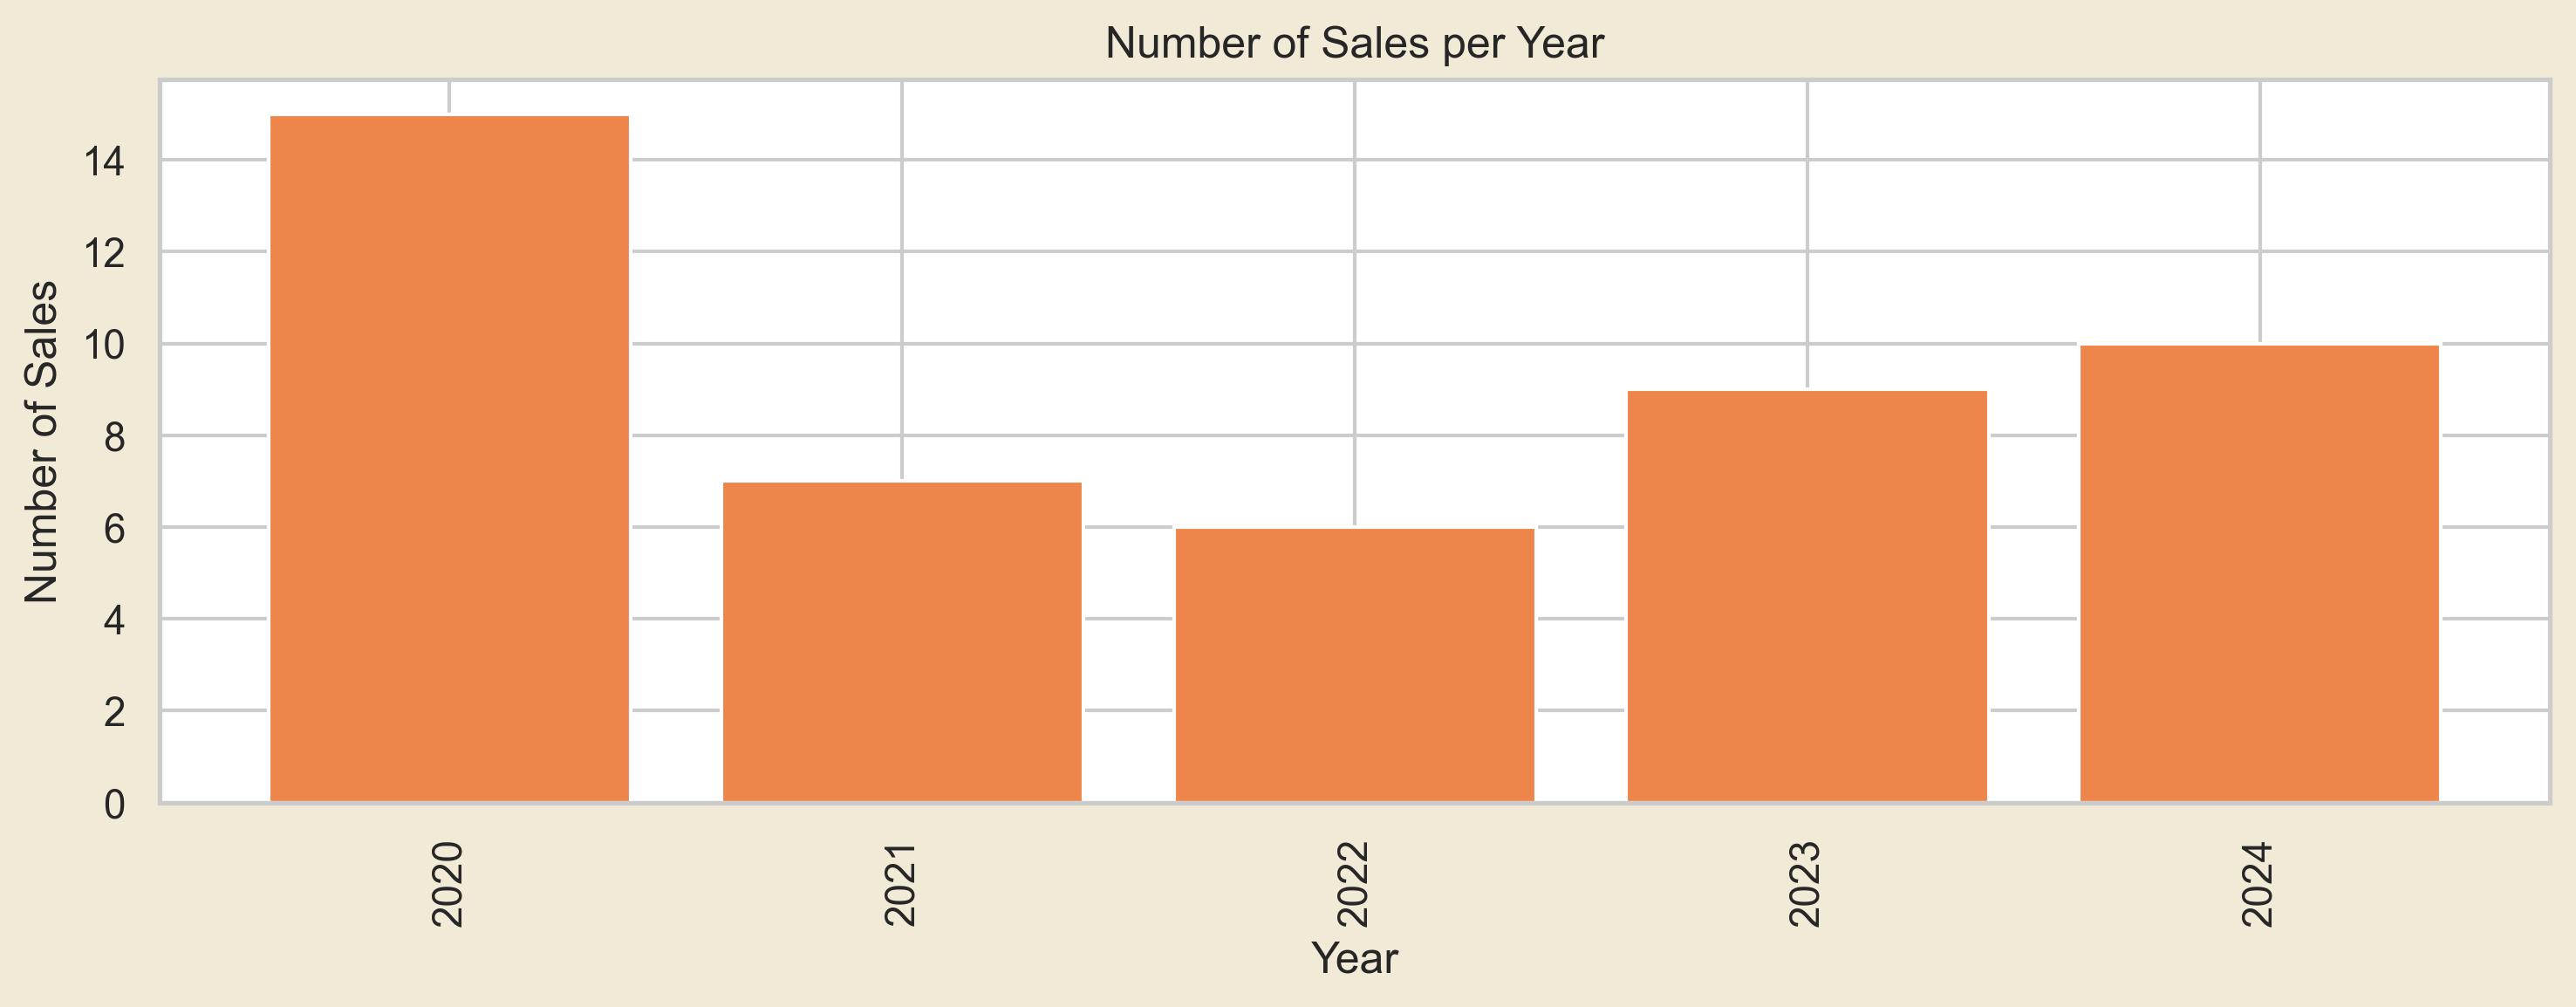
2020 – 2024 Lake Las Vegas Sales

Total sales for Lake Las Vegas from 2020 to 2024 (using only the most recent sale recorded in the tax record for each property, excluding repeat sales).

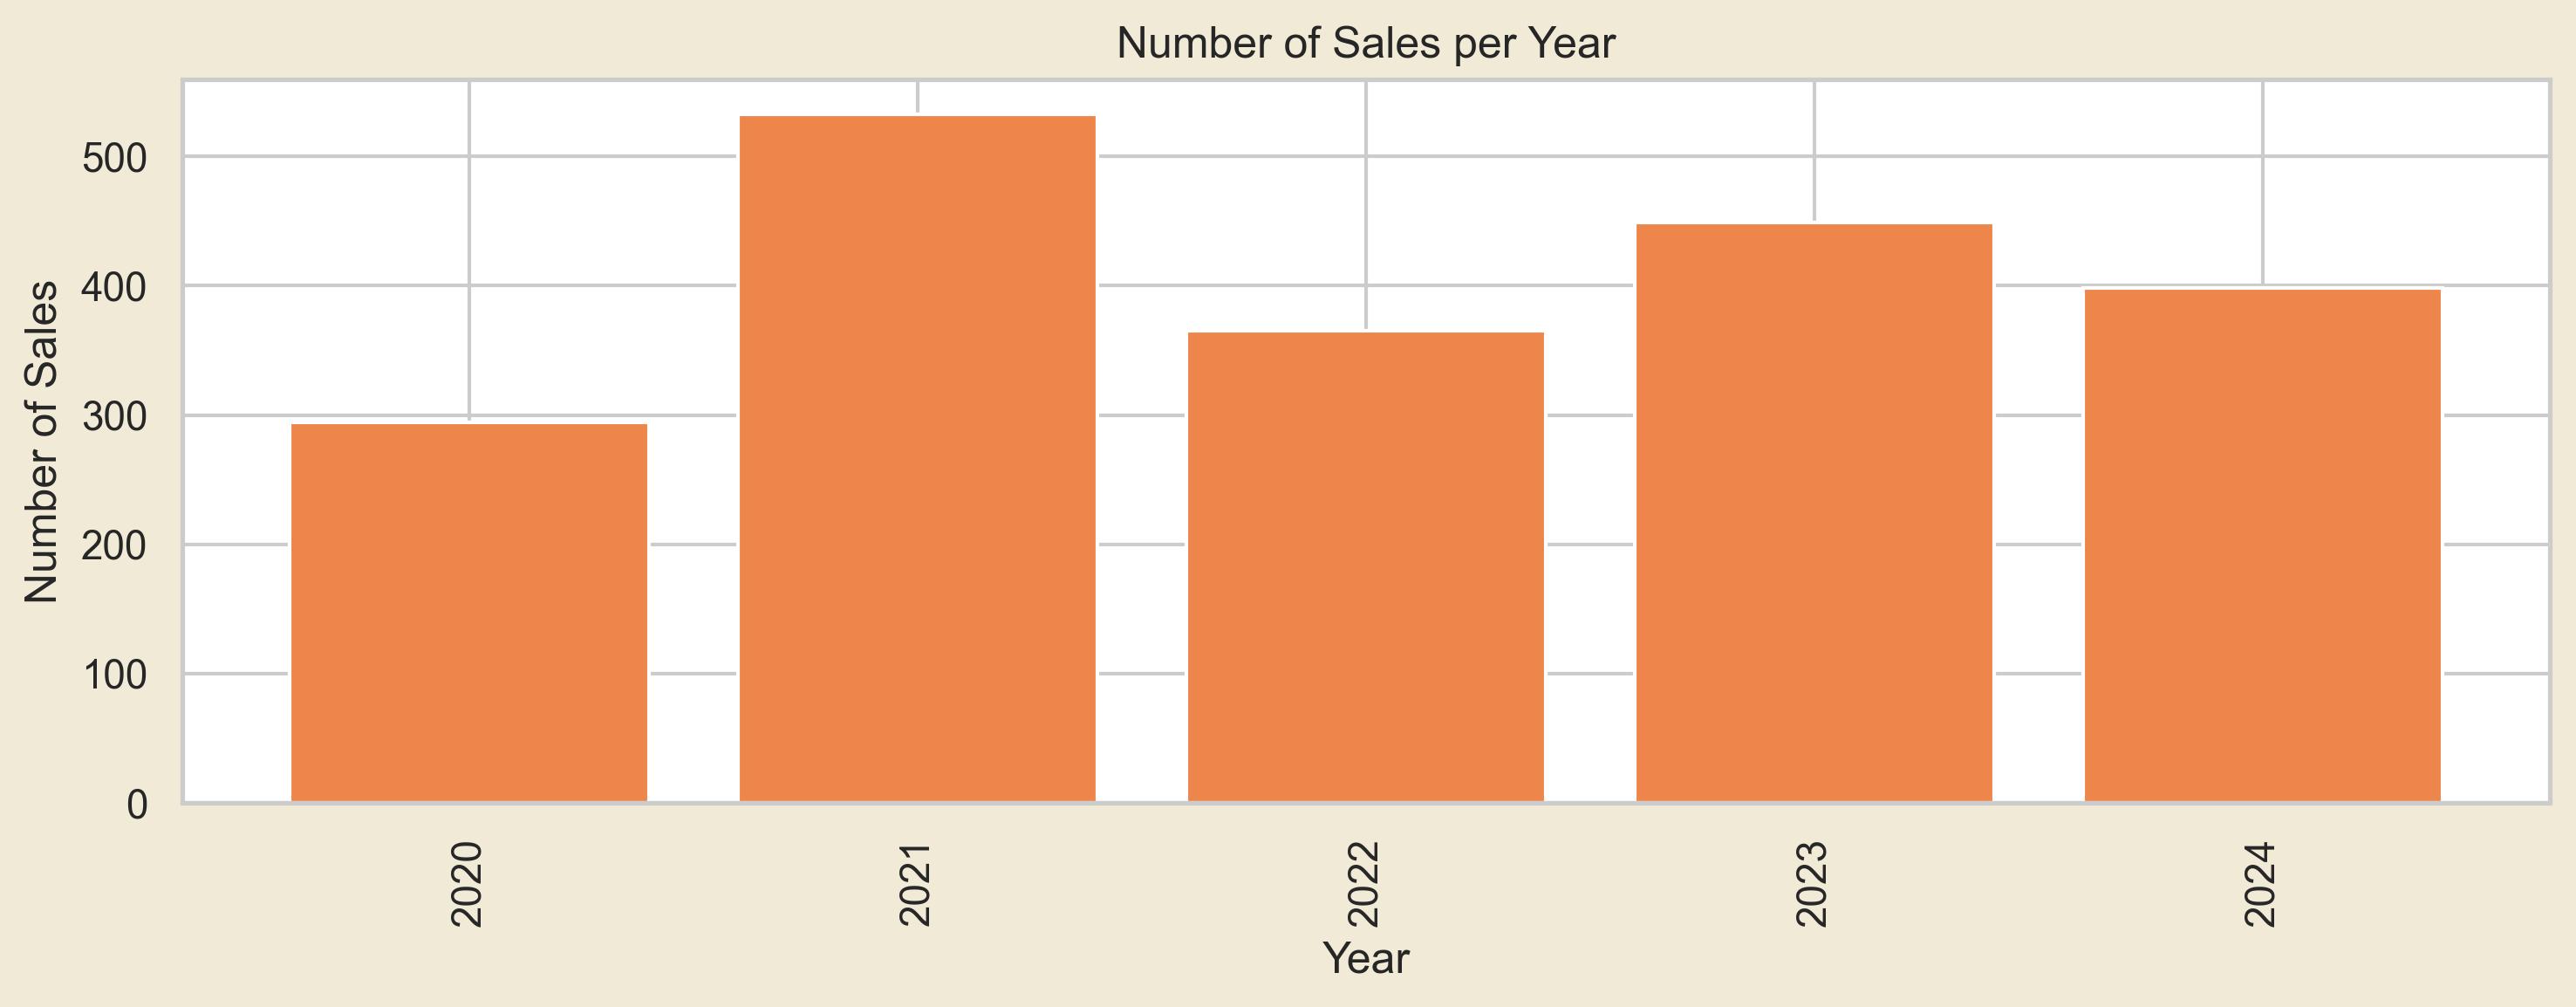
As shown above, the market has experienced a relatively stable sales period during the early 2020s. One key change in our new reporting system is that we now rely on tax records rather than solely on MLS data. This switch allows us to:

• Capture Private Sales: Include private transactions not listed on the MLS.

• Include New Home Builder Sales: Record sales that often aren’t in the MLS.

• Ensure Up-to-Date Data: Maintain a single, current entry per property—avoiding duplication from intermediary sales.

• Benefit from Cleaner Data: Leverage the robust, consistent feature data available from tax records.

Why rebuild our system instead of using data from Zillow? While Zillow does provide real estate data, it operates as a “black box” regarding how Zestimates are calculated and lacks the local expertise developed from over a decade of experience in Lake Las Vegas. Let’s continue our overview of recent trends before delving into more detailed analyses.

Lake Las Vegas price per SqFt from 2020 – 2024 rolling 12-Months

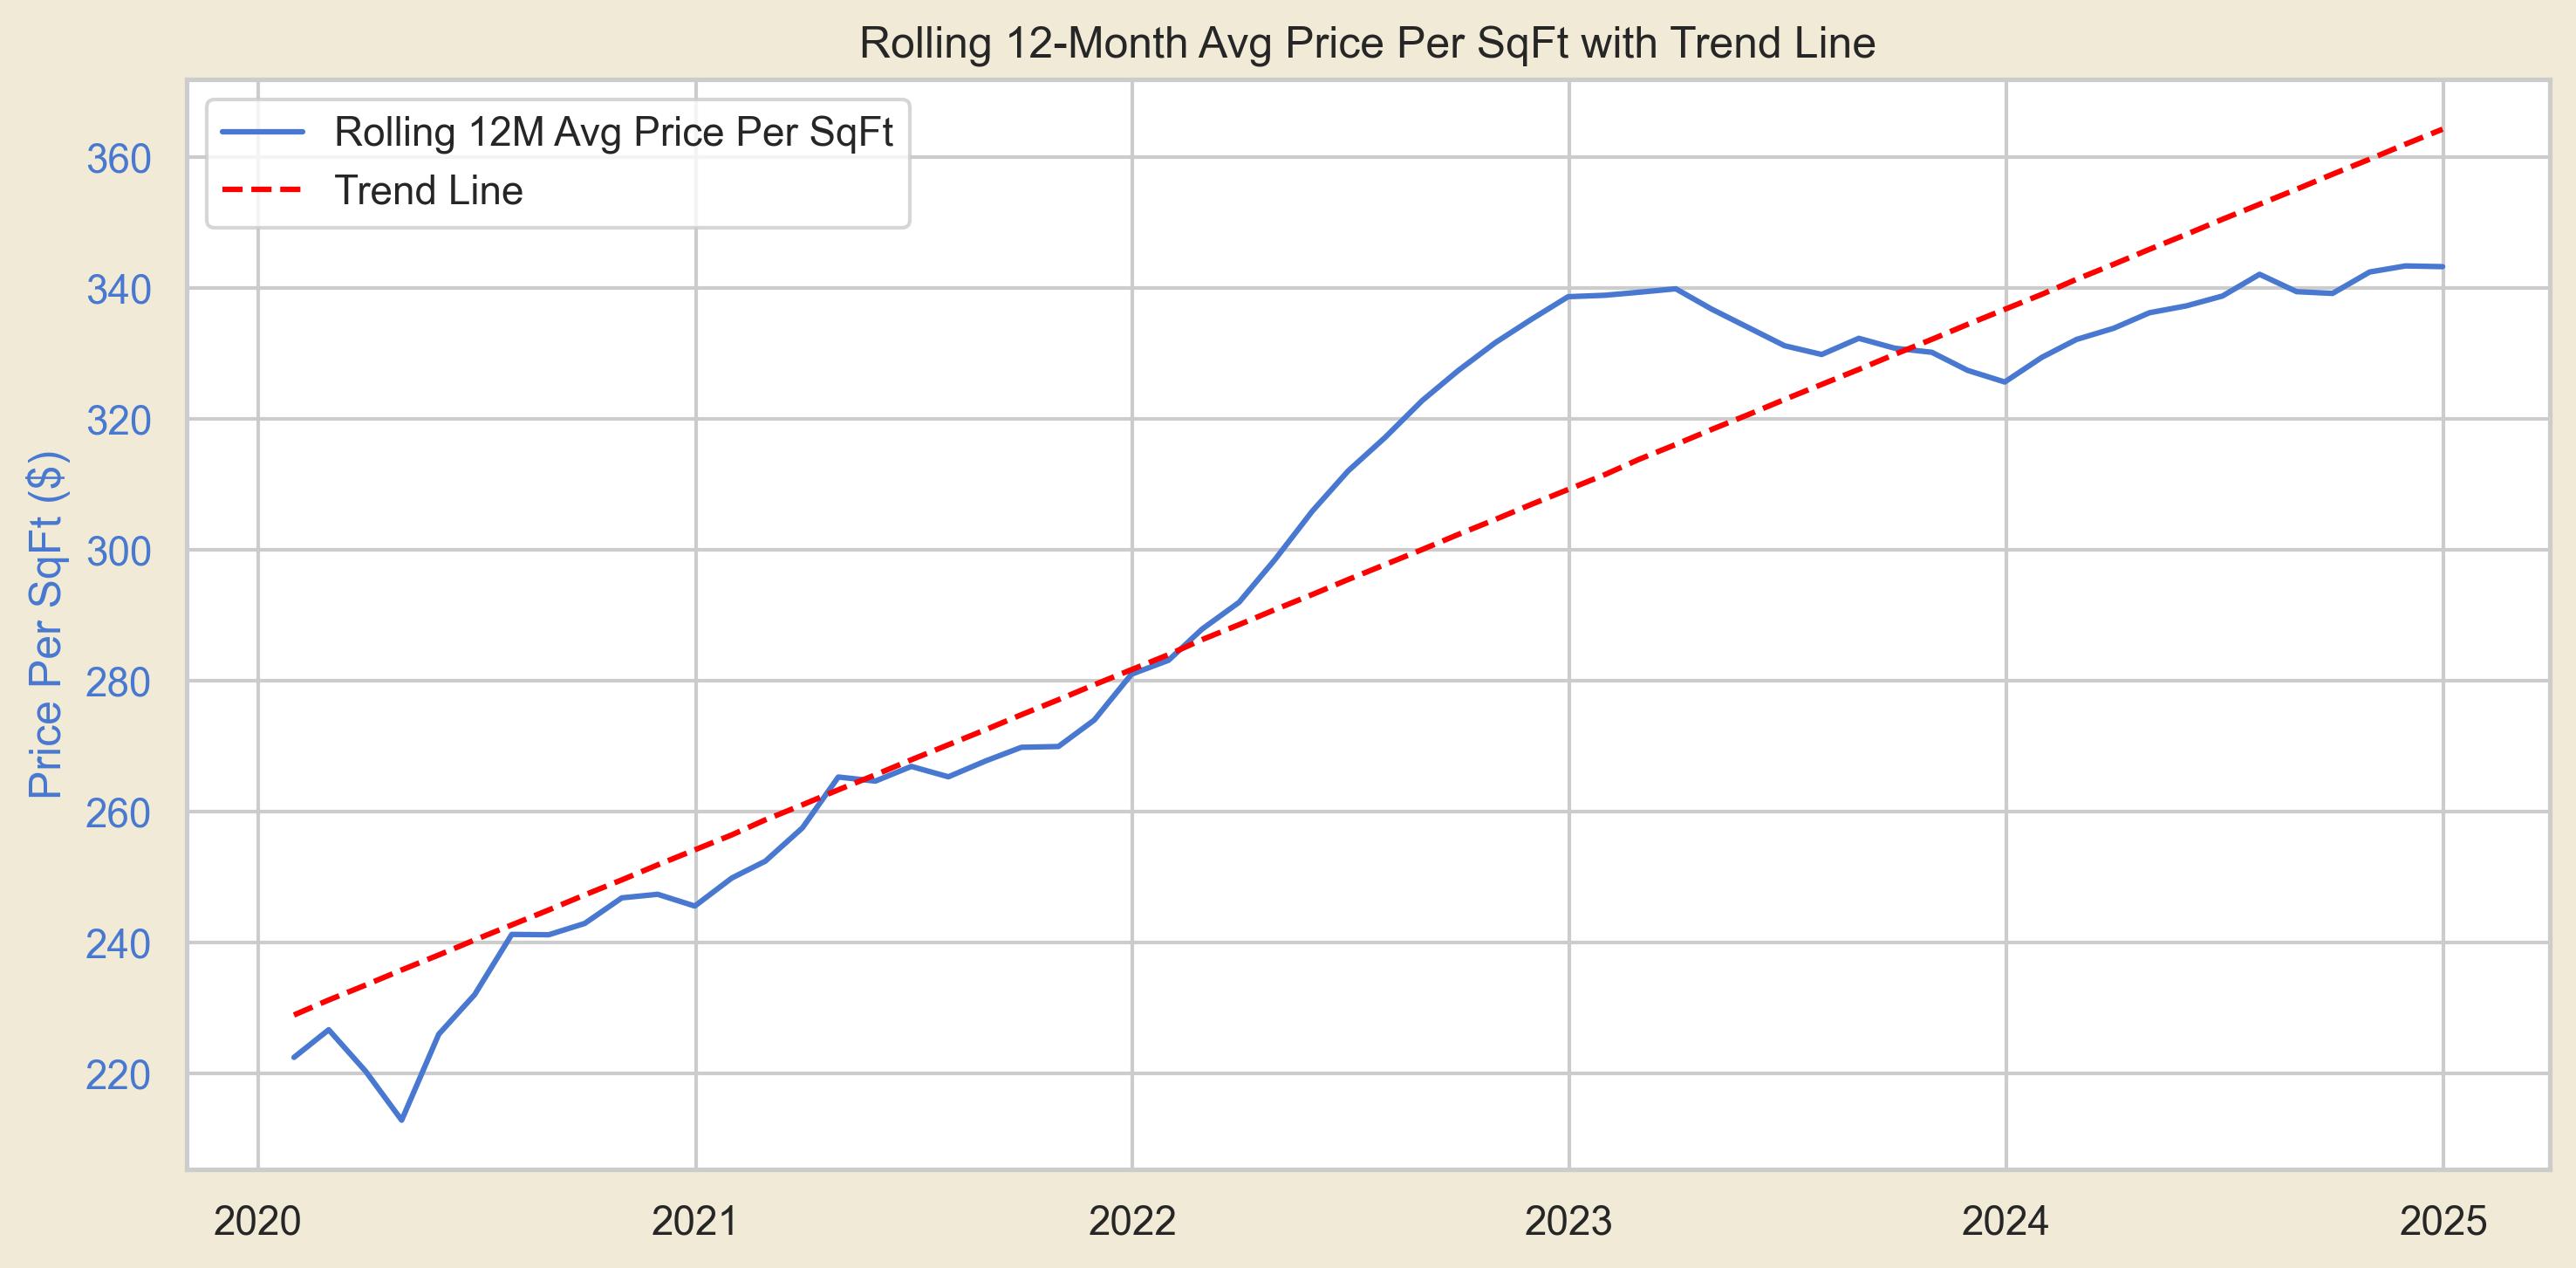
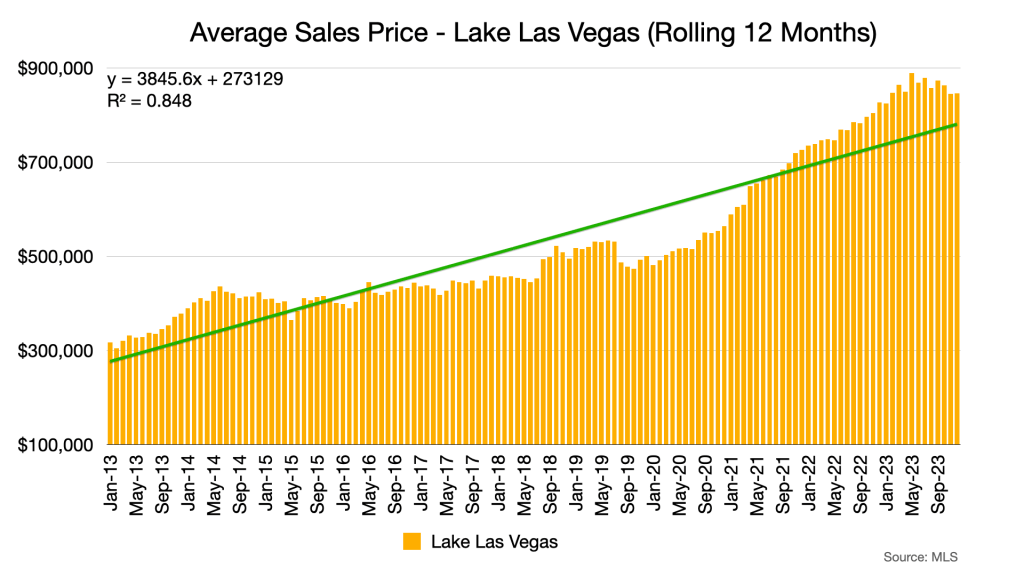
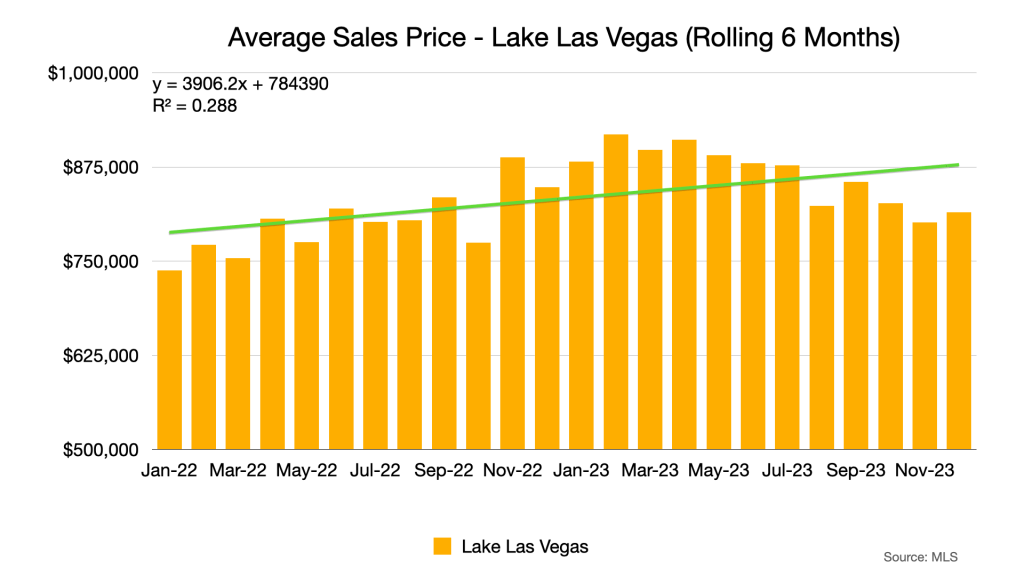
Compound Annual Growth Rate: 8.65%

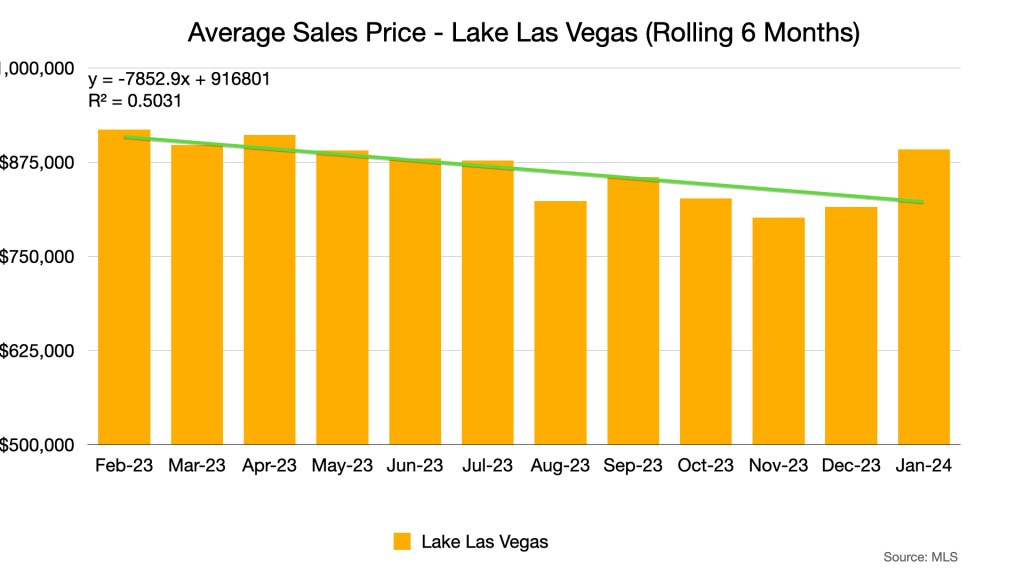
The line chart above shows the rolling 12-month average for price per square foot—based solely on the most recent tax record sale for each property, not every sale. From 2020 to 2023, the market saw a strong upward trend, with 2022 marking a particularly steep increase. However, interest rate hikes from late 2022 into 2023 pulled the market down from its peak of $340 per square foot, though recovery was evident by the end of 2024.

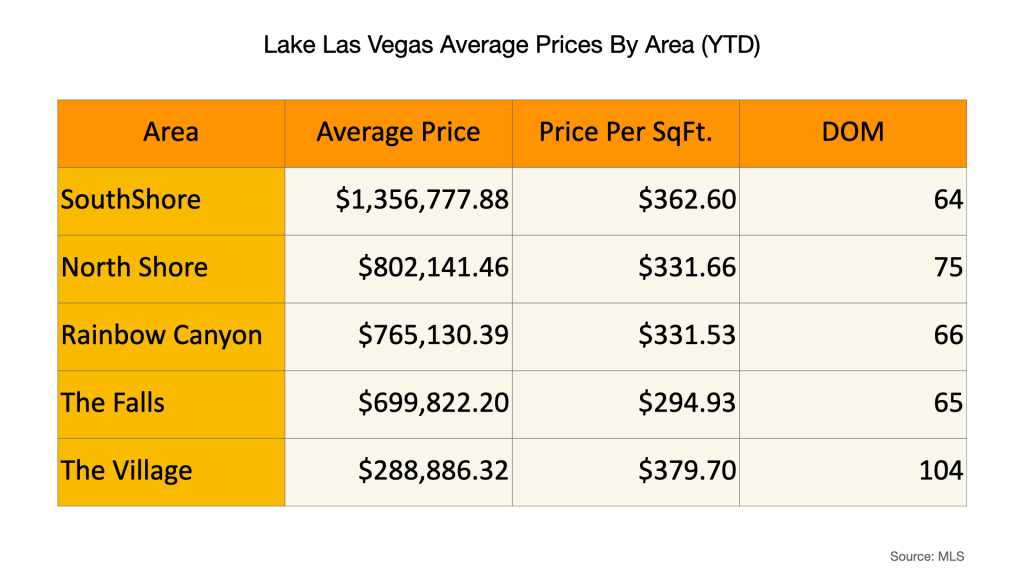
Remember that the $340 per square foot figure represents an average across all homes in Lake Las Vegas—from modest studio condos to expansive custom residences. While this overall number is informative, it doesn’t capture the unique characteristics of each community.

Below is a table showing the 2004 results for all communities:

CommunitySales CountAverage PriceAverage Price Per SqFt
Alta Fiore8$631,250.00$262.15
Amberock6$525,165.00$305.29
Armano1$605,000.00$280.35
Barcelona1$1,850,000.00$460.43
Bella Fiore10$1,005,200.00$323.61
Bella Strada26$1,442,321.00$441.85
Bella Vivente6$1,270,000.00$464.56
Bellano6$633,233.33$341.80
Biarritz3$3,438,227.67$618.58
Caliza3$3,408,000.00$543.00
Capri1$2,388,750.00$495.80
Casa Palermo3$1,062,666.67$362.12
Casa Villa Palermo3$569,000.00$295.39
Del Webb68$662,251.76$329.97
Golf Villas1$335,000.00$325.88
Lago Vista3$1,441,666.67$374.24
Luna Di Lusso11$214,218.18$400.59
Mantova10$558,750.00$277.19
Mantova Tennis Villas3$379,088.33$299.28
Marbella6$910,310.17$358.93
Marble Mesa19$626,508.37$310.92
Marseilles1$4,705,000.00$548.75
Mira Monte2$1,802,450.00$575.85
Monaco1$1,150,000.00$275.52
Monte Lucca4$1,078,000.00$388.61
Parker Point Estates3$3,811,000.00$680.60
Porto Villaggio1$1,850,000.00$528.72
Portocielo8$883,750.00$316.42
Portofino27$826,355.04$328.43
Ravello1$1,000,000.00$500.50
Regatta Heights7$971,285.71$335.69
Regatta Pointe3$585,000.00$262.10
Reverie21$728,495.95$295.89
Shoreline2$2,136,500.00$636.93
Siena1$3,600,000.00$638.41
Sorrento4$1,231,250.00$338.81
The Bluffs I19$498,754.21$283.16
The Bluffs II19$592,370.84$274.11
The Outlook6$1,065,750.00$418.60
The Peaks7$1,083,857.14$333.19
Tramonto7$659,285.71$272.68
Tremezzo1$1,350,000.00$456.08
V at Lake Las Vegas12$449,118.17$305.76
Vantage4$2,234,375.00$575.48
Varenna2$795,000.00$309.18
Viera16$261,881.25$365.44
Vila Di Lago3$809,666.67$335.27
Vila Di Lago Condos3$397,666.67$240.05
Villa Palermo (North)4$503,500.00$317.25
Villa Palermo (South)4$503,500.00$303.20
Vita Bella7$526,419.57$290.41

The table above provides context for the time series chart, allowing you to see how each community in Lake Las Vegas compares. Note that some communities have only one or two sales, and while we could expand this table to include multiple years, doing so might make the data less reflective of current market conditions.

Let’s focus in on Bella Fiore. First, let’s get perspective on the first half of the 2020s.

Bella Fiore 2020 – 2024

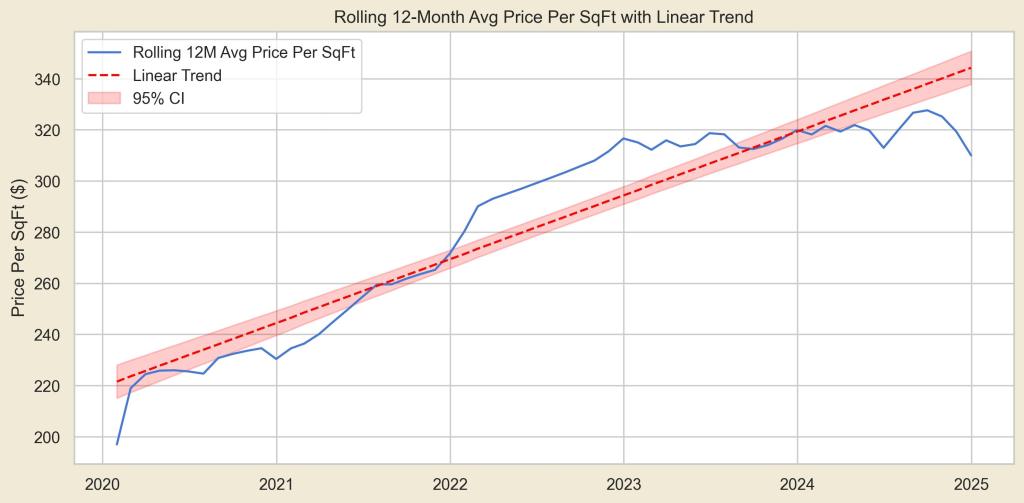
Compound Annual Growth Rate: 9.48%

This trend aligns with Lake Las Vegas’s overall performance, showing a slightly higher CAGR. Bella Fiore peaked around $319 per square foot before dipping in late 2023. With fewer annual sales, broader market trends may be less apparent due to time lags between transactions.

Examining broad price trends provides a useful baseline, but a deeper dive into the details is essential for truly understanding the Lake Las Vegas real estate market. Let’s explore our feature analysis.

Feature Analysis

Our upgraded reporting system also incorporates advanced machine learning algorithms that deliver deep insights into the features that drive price per square foot in Lake Las Vegas. Below is the feature importance plot for Single Family Homes—drawing on data from 1997 to the present, which captures extensive detail on nearly every home.

Feature Importance for Single Family Homes in Lake Las Vegas (All Time)
Red dots indicate higher feature values, while blue dots represent lower values. Dots to the right of the zero line push the model’s estimated price per square foot higher, while dots on the left push it lower. Features near the top of the chart have a greater influence on the model’s prediction than those at the bottom. Note that the x-axis doesn’t display the actual price per square foot; instead, it shows the magnitude and direction of each feature’s impact on the model’s estimate.

It’s clear that views play a significant role in Lake Las Vegas. When reviewing the community table above, keep in mind that while some communities include these premium features, the limited number of sales in a given area may not fully capture their impact on the average price per square foot.

Why Use Price Per Square Foot Instead of Sales Price?

Sales prices in Lake Las Vegas vary widely, as shown in the community table. Larger homes naturally cost more, which means size tends to dominate the feature space when comparing raw sales prices. This makes it difficult to isolate the impact of other factors.

For example, both a $2 million custom home and a $700,000 home can have a pool—so how do you determine whether the pool is influencing the price? Using price per square foot helps reduce the noise caused by extreme price differences, making it easier to assess the effect of individual features.

That said, price per square foot isn’t perfect. Some variability remains, particularly with home size. For instance, in certain communities, smaller homes tend to have a higher price per square foot than larger homes. This overlaps with the “Stories” category—two-story homes are often less desirable to certain buyers, but they also tend to be larger. Despite these complexities, the feature importance chart above offers additional clarity.

Larger homes often have a lower price per square foot than smaller homes because not all space is equally valuable. High-cost areas like kitchens and bathrooms carry similar expenses regardless of home size, while additional living spaces typically add less value.

Let’s take a closer look at the Bella Fiore homes to explore their features.

Bella Fiore Features (All Time)

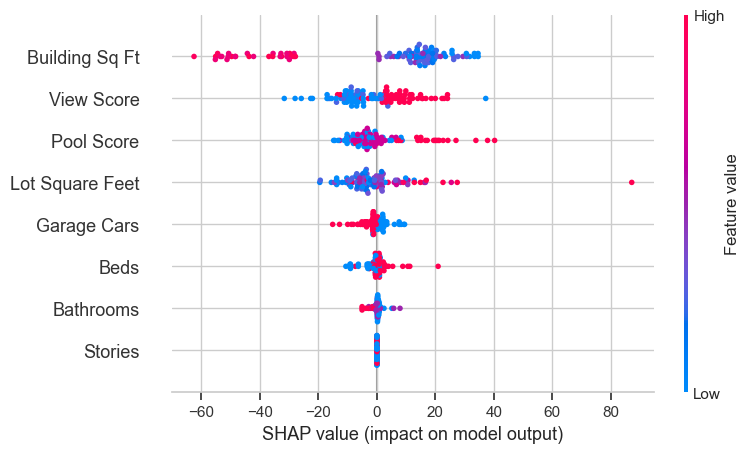
This dataset includes the most recent sale for nearly every home in Bella Fiore—109 in total. As seen in the chart, Building SqFt is the dominant factor, with larger homes (red dots) lowering price per square foot and smaller homes (blue dots) increasing it. Stories, however, ranks low in influence.

Bella Fiore has a handful of distinct floor plans, with larger homes typically being two-story. In some Lake Las Vegas communities, two-story homes are preferred for their elevated views. However, Bella Fiore’s best views are along the outer edges, making elevation less relevant.

This analysis highlights key factors but excludes interior design features like flooring, countertops, and appliances, which are difficult to capture consistently. While these elements do impact value, assessing them requires an in-person visit—something beyond the scope of this dataset.

Now that we have a bird’s-eye view of Bella Fiore, let’s take a closer look. View Score and Pool Score are composite features derived from more detailed view and pool data. Our proprietary view data is the result of extensive research, local expertise, and countless hours analyzing listing photos. The charts below compare features and price per square foot.

Scatter plot of adjusted price per square foot vs view score. Prices are adjusted using a LOESS smoothing model applied to the full dataset.
Box plot of adjusted price per square foot by Strip View. The blue box marks the middle 50% of the data with the median line, while the whiskers indicate the overall range, highlighting any outliers. Data is isolated to either Strip View or no view at all.
Box plot of adjusted price per square foot by Golf Front. The blue box marks the middle 50% of the data with the median line, while the whiskers indicate the overall range, highlighting any outliers. Data is isolated to either Golf Front or no view at all.
Box plot of adjusted price per square foot by Open Views. The blue box marks the middle 50% of the data with the median line, while the whiskers indicate the overall range, highlighting any outliers. Data is isolated to either Open Views or no view at all.

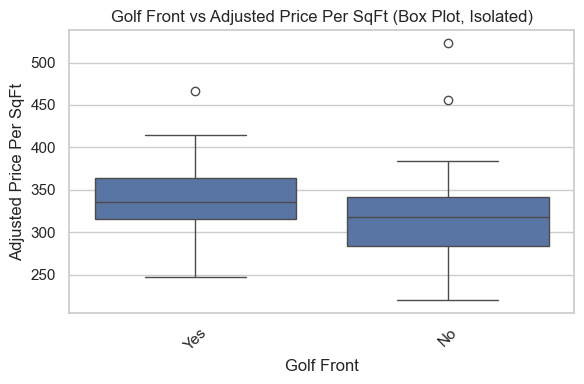
We begin by examining the View Score feature in detail. Since its meaning isn’t immediately clear, we break it down by view types. Globally, Strip Views and Golf Front Views are weighted equally, while Open Views carry a lower weight.

View Definitions:

• Lake View: The property offers a clear view of Lake Las Vegas from at least one vantage point.

• Golf Front: The property directly borders a golf hole or a well-maintained green space—similar to the manicured area at The Falls.

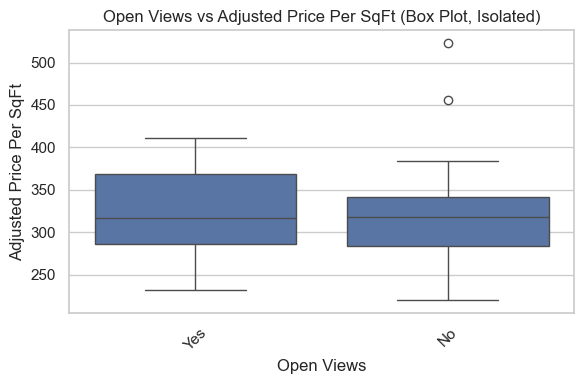
• Open Views: The home provides unobstructed views of the surrounding area, though without a distinct landmark.

• Strip View: The property affords a decent view of the Las Vegas Strip, or part of it, from a suitable angle.

• On Lake: The home sits directly on the lakefront with no intervening properties or obstructions.

Note that properties with “Open Views” are considerably fewer in Bella Fiore compared to other view types, so this final plot may be less representative.

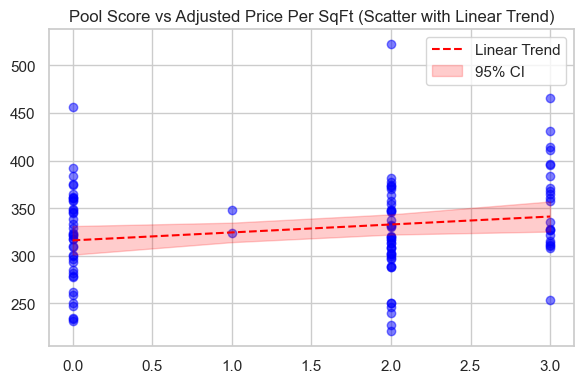
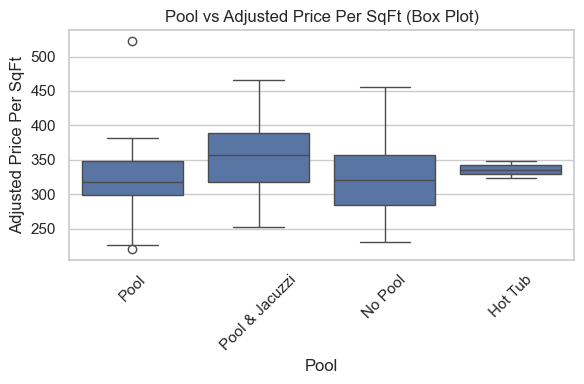
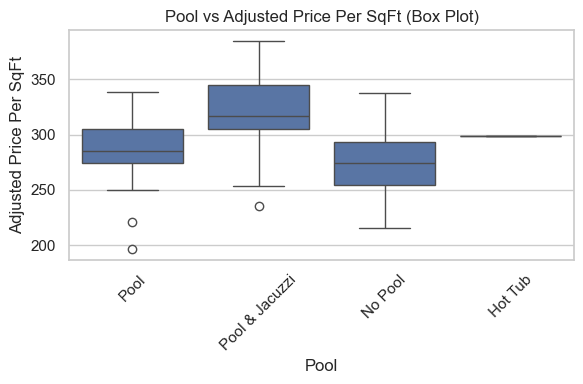
Now let’s examine pools. We see that pools are significant in Bella Fiore, but which types matter most? The box plot below draws on tax records for each home, so the pool categories are straightforward.

All values are adjusted to reflect current conditions. Overall, properties with pools—whether a simple pool or a pool and jacuzzi—tend to reach higher pricing levels than those without pools. While there is some overlap in price ranges, homes offering a pool amenity generally command a premium, reflecting buyer interest in added recreational features.

While these plots span 2006 to the present, focusing on 2020–2024 shows pools have a stronger impact on price in recent years. With higher installation costs and longer wait times, buyers appear more inclined to pay a premium for a home that already includes a pool.

Scatter plot of adjusted price per square foot vs view score. Prices are adjusted using a LOESS smoothing model applied to the full dataset.

Pools All Time

Box plot of adjusted price per square foot by pool type. The blue box marks the middle 50% of the data with the median line, while the whiskers indicate the overall range, highlighting any outliers.

Pools 2020 – 2024

Now, we have a clear picture of how each feature influences price per square foot. While much of this aligns with intuition—such as a home with a view being more valuable than one without—quantifying these factors provides a more precise analysis beyond gut instincts.

Wrapping Up

In conclusion, our enhanced reporting system provides a detailed, data-driven snapshot of the Lake Las Vegas market. By integrating tax records, advanced machine learning, and nuanced analyses of key features—like view and pool scores—we’ve uncovered insights that move beyond traditional intuition. This comprehensive approach not only highlights trends in communities like Bella Fiore but also empowers buyers and sellers with actionable intelligence. As the market evolves, our commitment remains to deliver clarity and precision, ensuring you stay informed and ahead of the curve.

Go back

Your message has been sent

Warning
Warning
Warning
Warning.

DOUGLAS ELLIMAN OF NEVADA LLC
1700 S PAVILION CENTER DR, STE 150
LAS VEGAS, NV 89135

David Foresi lic# S.0176578

Robin Foresi lic# S.0176572

Lake Las Vegas Market Update

May 2024 Report

A New Report Format

I am trying to make the information provided here a bit more relevant to Lake Las Vegas homeowners so if you like the new format, or have suggestions, please reach out. The new format is going to be more focused on core numbers and less on analysis since things don’t really change that much from month to month. As you’ll see below, there is an extensive community breakdown. This information can also be accessed on our Lake Las Vegas Real Estate Dashboard. The Dashboard will allow you to sort, filter and dive into the details down to the individual sales behind these numbers and goes back a bit over a decade.

Go back

Your message has been sent

Warning
Warning
Warning.

Lake Las Vegas by the Numbers

Lake Las Vegas Market Update

Please note that this is sorted in descending order by Homes Sold. I chose this sorting method because a higher sales number generally also means the averages presented are more reliable than a low sales number, so the most reliable information is on top and the least reliable or meaningfull information is at the bottom. The timeframe for this data is January 2023 – April 2024. I could go back further, but then it would be less relevant to our current period of time.

You can access, sort and filter this information here. You can also expand or shrink the timeframe and generate your own list at the link provided. Please note that some of the newer communities may not record all of their sales in the MLS and as such those sales will not be reflected here. If you want to quickly find your community on this list without scrolling, hit Command+F on Mac (CTRL+F in Windows) to search this page for your community.

CommunityPricePrice Per SqFt.Homes Sold
Marble Mesa$586.93K$307.3731
Reverie$700.21K$284.9726
The Bluffs$551.46K$277.3523
Del Webb$722.87K$359.8022
Viera$332.06K$348.4218
Armano$514.17K$253.5418
V At Lake Las Vegas$457.71K$308.8017
Portocielo$945.58K$317.9016
Luna Di Lusso$223.87K$400.4215
Mantova$564.45K$283.9914
Alta Fiore$595.54K$264.6314
Bella Fiore$934.32K$320.7812
Bella Vivente$1.24M$421.7911
Regatta Heights$904.4K$327.0310
Tramonto$681.77K$284.339
The Peaks$1.31M$391.159
Villa Palermo (North)$519.61K$281.989
Monaco$2.49M$405.368
Casa Villa Palermo$656.83K$303.486
Sorrento$1.49M$375.346
Vita Bella$506.5K$279.116
Casa Palermo$1.02M$324.576
The Outlook$1.09M$436.096
Vantage$2.19M$608.715
Capri$2.15M$427.555
Amberock$499.5K$304.785
Monte Lucca$1.13M$411.384
Golf Villas$368.13K$360.184
The Estates$4.62M$775.354
Bellano$597.22K$317.394
Biarritz$1.82M$390.504
Lago Vista$1.61M$385.624
Villa Palermo (South)$545.6K$319.434
Tremezzo$1.46M$419.893
Vila Di Lago$796.67K$277.683
Barcelona$1.98M$455.713
Siena$1.56M$372.593
Vila Di Lago Condos$415K$247.562
Ravello$699.95K$350.332
Shoreline$1.99M$562.962
Regatta Pointe$584.5K$257.612
Portofino$703.5K$300.372
Bella Strada$1.33M$385.442
Mira Monte$1.89M$598.842
Varenna$811K$337.982
Marseilles$4.71M$548.751
Mantova Tennis Villas$330K$285.471
Porto Villaggio$1.65M$336.941

See you around the lake!

Thank you,

Robin & Dave

Go back

Your message has been sent

Warning
Warning
Warning
Warning.

Lake Las Vegas Market Update

February 2024 Report

A Good Start

We had a nice price spike to start off 2024. Hopefully this slows the slight downward trend we’ve been seeing. The good sales price spike was offset with some inventory headwinds. In all, January was fairly balanced.

Lake Las Vegas by the Numbers

Not a bad way to start the year. We had a nice uptick in average price for January.

After December’s nice sales rally, we’re cooling off, but keep in mind that the end of December and early January are holiday heavy months. Home buyers are not necessarily out looking due to travel, family obligations and other holiday related activities.

There was a spike in listings coming into 2024. Sales activity tends to drive listings because people see the activity, like the outcome, and decide to list. As of this writing (2/16/23), there are 19 homes that have gone under contract in the month of February, so we’ll see if the home buyers finally wrapped up their holidays.

Go back

Your message has been sent

Warning
Warning
Warning.

The recent spike in listings brought us from 5.9 to 6.7 months of inventory which is still a balanced market.

A spike in inventory adds competition to the market. Competition allows for more aggressive offers.

Please note that these numbers are for closed sales and therefore were put under contract at a time when mortgage rates were near their highs for 2023. Throughout mid December and January, rates have been down below 7% for the most part. As a result of this lower interest rate situation, mortgage applications (purchase) have spiked a bit, reaching a peak in late January. These buyers are likely going to pull the trigger in the next couple of months.

Final Thoughts

The new year is starting out rather balanced. We are headed into spring and I did finally manage to go outside without a jacket or sweatshirt so that’s something. We’re starting to see an uptick in activity in our daily feed (sales, homes under contract, showing requests etc…), but that is all mostly anecdotal. That said, sometimes that anecdotal information turns out to be the beginning of a trend. We’ll keep our eyes and ears open to see what trends, if any, emerge as we head into spring.

Thank you,

Robin & Dave

Go back

Your message has been sent

Warning
Warning
Warning
Warning.

January Newsletter Archive

Welcome to the R & D!
Happy New Year!

We’re going to kick off 2024 with a longer than usual recap of 2023 in the Lake Las Vegas Market Update. There are a few events coming up in The Village so prepare yourself. Hint, you are either going to be wearing platform shoes or Mardi Gras beads. If you see any professional football player around don’t be surprised, they are staying here so they don’t get into trouble in Sin City before the big game. In the Cabo section we present Querencia, a luxurious community in San Jose not far at all from the airport or the beach. And while in San Jose, be sure to do their weekly art walk. In the Travel section we have a fantastic Rhine River cruise and the Orient Express! In the Rabbit Hole, check out the latest in LED television tech making waves at CES this year and then take a tour of the Milky Way Galaxy. 

If you know someone that would enjoy our newsletters feel free to forward this email to them so they can sign up!

Enjoy!

​​​​​​​Robin & Dave

Sign up below to receive this monthly newsletter directly to your inbox.

Go back

Thank you for signing up for the R u0026amp; D!

Warning
Warning
Warning.

Lake Las Vegas Market Update
2023 in Review January 2024 Report 2023 Year in Review This past year has seen relative stability in the market. Although the 2022 interest rate hikes caused some turbulence, Lake Las Vegas weathered the storm. We’ll take a look at 2023 to see just how we weathered that storm. Lake Las Vegas by the Numbers…
Where will Super Bowl teams stay the week of game?
The NFL doesn’t want its Super Bowl participants to be distracted by the hustle and bustle of the Strip the week of the Feb. 11 game at Allegiant Stadium, so neither team will be staying on the famed Las Vegas Boulevard. The AFC and NFC representatives will stay at separate properties in Lake Las Vegas, said Jon Barker, senior vice president of global events and live production with the NFL, …

The River Mountain Loop trail is a 35 mile trail that takes you into Lake Meade and returns you to Lake Las Vegas.

The Village At Lake Las Vegas on Instagram: “Who’s ready to Party?! 3rd Annual Mardi Gras here in the Village at Lake Las Vegas!! Alongside with Speakeasy and their staff the party will go on throughout the night 🎭📿🥂 @thespeakeasyllv”

If you want to dive deeper into the Lake Las Vegas real estate data check out our dashboard! You’ll be able to explore sales activity at a community by community basis spanning over a decade of sales. Please let us know if you have any questions about the data!

Sign up below to receive this monthly newsletter directly to your inbox.

Go back

Thank you for signing up for the R u0026amp; D!

Warning
Warning
Warning.

Robin and Dave are licensed to sell real estate in Baja Sur Mexico!
Start your Cabo home search with us!

Cabo Luxury Homes for Sale | Querencia

Querencia Private Golf & Beach Club in Los Cabos offers unique luxury homes, convenient condominiums & custom homesites. Find your retreat.

The Cabo Life – Robin & Dave Los Cabos
Check out our blog post about Cabo life! The photo above is a real drone shot of one of the beaches we frequent down there called Playa Las Viudas. Some days it is practically empty. This is a drone image I took while we were there.

San Jose del Cabo Art Walk – Gallery District San Jose del Cabo

Robin and David Foresi
Check out our travel agency. Give us a call when you’re ready to start planning, or just to get some ideas.

Boutique Rhine River Cruise by Uniworld. 
Check out this fantastic Rhine River cruise from Nuremberg Germany to Basel Switzerland. Click the link to explore the itinerary.

Sign-up for our newsletter,  The Sophisticated Traveler, for a passport to elegance and extraordinary destinations.

The Orient Express By Belmond – Give us a call to begin your adventure. (702) 582-0314.

Samsung’s Transparent LED at CES

100,000 Stars. An interactive 3D visualization of the stellar neighborhood, including over 100,000 nearby stars. Created for the Google Chrome web browser.

If you know anyone that would be interested in receiving The R & D Newsletter, please share this page with them.

Thank you!

Robin & David Foresi
Global Real Estate Advisors
Robin: (702) 592-0679  David: (702) 858-8833
robin.foresi@elliman.com
david.foresi@elliman.com
10777 W. Twain Ave. Suite 230
Las Vegas, NV, 89135
Lic# S.0176578 & S.0176572

Lake Las Vegas Market Update

2023 in Review

January 2024 Report

2023 Year in Review

This past year has seen relative stability in the market. Although the 2022 interest rate hikes caused some turbulence, Lake Las Vegas weathered the storm. We’ll take a look at 2023 to see just how we weathered that storm.

Lake Las Vegas by the Numbers

Here are the five areas of Lake Las Vegas broken down by average price, Price per square foot and days on market (DOM). Please keep in mind these areas each have a diverse inventory so some communities performed differently than their broader areas.

These communities are not all perfectly homogenous, especially South Shore and other custom home communities like The Estates. Larger homes might bring in a higher net price, but a lower price per square foot. If you want to dive into these numbers feel free to play around in our interactive dashboard.

First, let’s take a moment to gain perspective on the long term, because real estate is a long term investment. This chart is ten years of data showing a rolling 12 months average to smooth out some of the seasonal volatility. We’ve come a long way as you can see. I remember seeing listings in SouthShore that were selling for almost $500k in 2012/2013 that are now worth north of $1MM. As you can see the growth rate was fairly slow until 2020. We’ll zoom in on this chart below to explore it in recent context.

Now we zoom in to the last couple of years. The trajectory is still upwards. Note that each bar is a rolling 6 months of sales. If you were to look at the six months of sales one bar contains, you would see some extreme volatility. Volatility is not the state of the market, it is better to describe it as natural variability.

2023 seems to have offered a bit of a cooling off from the frenzied growth of the prior few years.

Go back

Your message has been sent

Warning
Warning
Warning.

December 2023 saw a nice spike in sales. This is a great way to head into 2024. Although Spring may bring more listings, having a decent selloff to ring in 2024 helps keep the inventory from piling up during the slower winter months.

And here is some additional good news for year end. For the first time in 2023, we see pending sales for December above new listings. These pending sales will likely close sometime in January or very early February, which could give us yet another inventory reduction as we head into a year that may well see lower interest rates due to Fed activity.

All of the sales and pending sales above come into play here. This is a good balanced market and for Lake Las Vegas, this is relatively low inventory. Buyers still have room to negotiate in this market, but sellers have some pricing power as well. Keep in mind this is for all of Lake Las Vegas. Inventory is highly local. Some communities and areas of Lake Las Vegas perform differently than others.

This is 10 years of monthly inventory for Lake Las Vegas to offer perspective. The blue area represents inventory above 6 months. Although inventory has accumulated starting in the second half of 2022 and through 2023, we are not too far off from where we usually are. Although each bar represents a month of activity, the calculation for this number is the number of homes for sale at the end of a month, divided by the average monthly pending sales from the last 12 months.

Two things are happening here. First, there is some competition in the market as evidenced by the sales activity mentioned above. Second, prices have adapted to the market a bit. Anecdotally speaking, we haven’t seen a lot of price reductions come through our activity feed. Average prices are lower though, so there is some competitive pricing going on out there.

If interest rates continue to go down and stay down from their highs earlier in the year, we may see more loan purchases. The 2024 maximum conforming loan rate for Clark County Nevada is going up from $726,200 to $766,550 which brings more homes into the loanable range.

For 2023, Lake Las Vegas balanced out at 49% Cash to 51% Loan. I will, however, point out that many loan buyers likely put in a substantial cash down payment to cover the gap between the max loan amount and the price of the home, not to mention to reduce their interest rate. Since we cannot see the exact terms of each loan, we do not know how much actual cash was used in these loan transactions.

Interest rates are expected to go down somewhat in 2024. This is partially due to indications from the Fed that they are not planning any rate hikes and may be making some cuts. This website does a good job of tracking mortgage rates and applications. They also offer quite a bit of useful commentary. If cuts are made, and cuts are expected, we may see more of those loan buyers making offers here at the lake.

Final Thoughts

The past year has offered a good insight into how resilient the Lake Las Vegas real estate market is. The short term experience of market corrections and changes are always colored a bit by our experience of the past. In short, new information does not take root in the mind as quickly as that new information emerges. Price adjustments happen and the market adapts slowly because transactions take time to close. Buyers and sellers adapt, they shed the uncertainty that held them back from taking action because they have seen the resiliency of the market even if that notion was only realized in the subconscious.

The market shock of a rapid jump in interest rates lingered. Buyers were more acutely aware of the interest rate hikes than sellers might have been, but remember, sellers are usually buyers too. They need to move somewhere. Inventory spiked because demand dropped, not because there was a sudden need to liquidate home equity. But then the invisible hand of the market nudged prices down. In this case, the part of the Invisible Hand was played by lower demand.

We also learned that although the national real estate market can be analyzed as a whole, real estate is a highly localized market. Nevada received a continuous influx of new residents from California. Searches for real estate in Las Vegas and Lake Las Vegas originated from Los Angeles and surrounding areas in large enough numbers for the Google machine to take note. These buyers all came from a completely different market. They came in with plenty of cash and we could see that in the data. Cash buyers bought homes in all price ranges here in Lake Las Vegas. Cash was an important part of our resiliency.

The coming year holds some potential for an uptick in buying and possibly selling. I don’t see any reason why selling activity should increase too much as there are no apparent economic factors that are forcing home owners to sell. I suppose some sellers could be waiting on the sidelines hoping for lower interest rates to not only boost their home value through greater buyer demand, but to also loosen the golden handcuffs of their current low interest mortgage a bit so they can buy elsewhere without feeling like they surrendered a fantastic financial situation. But those sellers are likely very few and far between. Most people don’t make a decision to move purely on those types of subtle economic concerns, they do so because they need or want to move for personal or work related reasons. My point is, inventory is not likely to go up much in the coming year unless some sort of drastic economic circumstance forces people to sell. If inventory stays relatively the same or even spikes a bit, and demand grows due to improved purchasing power, we may see some home prices stabilize or even go up. I’m not going to predict a home price boom here, because we’re all a bit beholden to a few folks down at the Fed, but the ingredients for a decent lift in home values seem to be on the table for 2024.

Thank you,

Robin & Dave

Go back

Your message has been sent

Warning
Warning
Warning
Warning.

December Newsletter Archive

Welcome to the R & D!

We did another deep dive in the Lake Las Vegas Market Update. Some good news on interest rates. Lake Las Vegas takes gold… again. An ode to the Cabo lifestyle. Check out the fantastic Caribbean cruise offered by Seabourn. And, in The Rabbit Hole, robots! Yes, we’re nerds. 

Enjoy!

​​​​​​​Robin & Dave

Sign up below to receive this monthly newsletter directly to your inbox.

Go back

Thank you for signing up for the R & D!

Warning
Warning
Warning.

Lake Las Vegas Market Update
December 2023 Report Balanced Activity There was a slight decline in prices. We’ll analyze prices from the perspective of price bands to hopefully gain some insight into the underlying market dynamics in play. There was a bit of an inventory improvement but also a decline in sales. I think the sales decline and the listing…
The Fed holds rates steady, expects 3 rate cuts in 2024
The Federal Open Markets Committee (FOMC) held its short-term policy interest rate steady at a range of 5.25% to 5.5% at its last meeting of the year on Wednesday.

Best of Las Vegas 2023 | Lake Las Vegas has been recognized as the Best of Las Vegas Gold Winner for Master Plan communities in Southern Nevada for the second consecutive year!… | By Lake Las Vegas

Lake Las Vegas has been recognized as the Best of Las Vegas Gold Winner for Master Plan communities in Southern Nevada for the second consecutive year!…

Lake Las Vegas – ‘Tis the season to give back! We’re…

‘Tis the season to give back! We’re teaming up with SouthShore Country Club for a Sock Drive to benefit Shine a Light Foundation this holiday season….

If you want to dive deeper into the Lake Las Vegas real estate data check out our dashboard! You’ll be able to explore sales activity at a community by community basis spanning over a decade of sales. Please let us know if you have any questions about the data!

Sign up below to receive this monthly newsletter directly to your inbox.

Go back

Thank you for signing up for the R & D!

Warning
Warning
Warning.

Robin and Dave are licensed to sell real estate in Baja Sur Mexico!
Start your Cabo home search with us!
The Cabo Life – Robin & Dave Los Cabos
Check out our blog post about Cabo life! The photo above is a real drone shot of one of the beaches we frequent down there called Playa Las Viudas. Some days it is practically empty. This is a drone image I took while we were there.
Robin and David Foresi
Check out our travel agency. Give us a call when you’re ready to start planning, or just to get some ideas.

7 Night Sailing On Seabourn Seabourn Ovation Departing On 01/21/2024

Sunday, January 21st 2024 – Sunday, January 28th 2024
A luxurious cruise through the Caribbean on Seabourn. Click below to review the itinerary and explore this fantastic cruise.

Sign-up for our newsletter,  The Sophisticated Traveler, for a passport to elegance and extraordinary destinations.

Elon Musk is building an army of robots. Don’t worry though, they seem to move slowly.

If you know anyone that would be interested in receiving The R & D Newsletter, please share this page with them.

Thank you!

Robin & David Foresi
Realtors
Robin: (702) 592-0679  David: (702) 858-8833
robin.foresi@elliman.com
david.foresi@elliman.com
10777 W. Twain Ave. Suite 230
Las Vegas, NV, 89135
Lic# S.0176578 & S.0176572

Lake Las Vegas Market Update

December 2023 Report

Balanced Activity

There was a slight decline in prices. We’ll analyze prices from the perspective of price bands to hopefully gain some insight into the underlying market dynamics in play. There was a bit of an inventory improvement but also a decline in sales. I think the sales decline and the listing decline balance each other.

Lake Las Vegas by the Numbers

The price slowdown continues. Keep in mind that this chart includes all sales in Lake Las Vegas.

We’re going to break price performance down by these price bands so we might as well discuss how they are purchased a bit first. The cash heavy activity hits the top and bottom band more than the middle bands, but the story is a bit incomplete. The under $499k band attracts quite a lot of investor activity, especially smaller condos that fetch high rents, many investors pay cash. This price point is also more easily purchased with cash.

The million plus category fetches cash buyers because at this price point, a conventional loan will not cover the full purchase price and a Jumbo loan is just not something many buyers want to deal with.

The $500k – $799k band is where most of the new home construction inventory is sold. The seller/builder can offer incentives to make the loans more affordable so people are less inclined to pay cash when they can get a rate buy down from the seller.

The $800k – $999k band is above the 2023 conforming loan limit of $726k so many borrowers will need to make a large down payment. Think north of 20% maybe even north of 50% in some cases. This added down payment often helps reduce the interest rate. I cannot consider someone who might be putting 50% down as a “cash” buyer, but they certainly need to have quite a sack of cash to finance a home in this band. Note that the 2024 conforming loan limit will be $766,550 so more homes in this price band may become approachable to borrowers next year.

This chart represents all types of inventory in this price band. The steep drop towards the end was driven almost exclusively by condos.

Go back

Your message has been sent

Warning
Warning
Warning.

This drop in prices was more uniform across Single Family, Condo and Townhome, but Condos did take the biggest hit. This price band, like the one before it would be more likely to be influenced by increased cost to borrow AKA interest rate hikes. Condos are especially difficult to finance due to their higher than average HOA dues since those dues become an expense lenders must consider for loan approval.

This price band shows a bit more resiliency to interest rate hikes. There is less inventory available in this price band and that probably contributed to the relatively smaller price dip shown here, but it also contributes to short term volatility. The volatility is an artifact of the limited inventory, not an indication of a wavering market. This market band is attractive to cash heavy buyers because these homes tend to fulfill many of their expectations in terms of size, bedrooms and location. Although these buyers may still take a loan to buy, they are willing and able to make a larger cash down payment to cover the difference between their maximum loan available and to reduce interest.

This price band is almost immune from the cost of lending (interest rates). Of course interest rate changes are reflections of other economic headwinds, but things like inflation, unemployment and such are more easily absorbed by buyers and sellers who own or buy in this price band. I would be reluctant to suggest any sort of trend is present in this chart. Sales happen slowly at this end due to the limited buyer pool. One or two big sales can throw off the chart for a month or two.

I think now would be a fine time to check in on a helpful indicator of buyer sentiment, the mortgage (purchase) application rate. After a spike in interest rates in the latter half of the year slowed and then dropped, mortgage applications perked up. This activity began around the first of November and has continued on into the early days of December. These applications will probably drive a bit of buying activity in the coming months and going into spring. You can follow this application data here: https://www.mortgagenewsdaily.com/data/mortgage-applications

Make sure to scroll down to the third chart in the link above for the “Purchase” applications.

Last month inventory was at 7.7 months. We’ve come down a bit from that due to a slowing of listing activity and a slight uptick in pending sales. As noted in last month’s report, each area of Lake Las Vegas represents a different variety of homes, prices and inventory levels. This gauge represents all inventory. Some communities within Lake Las Vegas may outperform others so this is really just a broad reading on the health of the whole LLV market. We’re balanced. This is good. Buyers get an opportunity to negotiate while sellers know that limited inventory will protect the equity they’ve accumulated.

I’ve broken down the months of inventory by price band. The 7 months of inventory in the million plus band is more representative of the time it takes to sell a home in that price band than it is an indicator of available inventory. Remember, “Months of Supply” is a measure of how long it would take to sell all of the available inventory assuming no new inventory comes along, not how long it takes to sell one home.

The inventory in the $500k-$799k is a bit high due to the fact that there is so much builder inventory out there. I discussed this inventory in last month’s report.

The $800K-$999K inventory is lower than most due to its popularity among cash heavy purchasers (large cash downpayment with a loan or outright cash) and a general lack of inventory growth AKA listings.

There has been a reduction in sales since the peak in September. Much of this is normal seasonal market variation.

New listings are down from the prior month as well.

Final Thoughts

Different price bands perform differently and have their own inventory considerations. The higher price bands naturally attract cash buyers mostly due to the appeal of that available inventory to those that can afford to put out that much cash or make a larger down payment on a maxed out loan. The lower bands get cash buyers as well, but builder lending incentives are making that inventory competitive against resale inventory of the same price.

Listing activity has slowed a bit, but is still within the normal range and inventory has come down a bit too. As we head into the new year we may yet see some buyers come out now that they’ve had an opportunity to lock in a more favorable interest rate. We’ll keep our eyes open to see how this plays out.

Thank you,

Robin & Dave

Go back

Your message has been sent

Warning
Warning
Warning
Warning.

Lake Las Vegas Market Update

November 2023 Report

Inching Lower

Prices are still continuing to decline though the decline is not universal nor is it extreme. Inventory spiked a bit in October, but this too was not universal.

Lake Las Vegas by the Numbers

Not much change here. It does seem like there is a bit of a plateau forming though.

We’re still holding onto gains made before the rate hikes.

Go back

Your message has been sent

Warning
Warning
Warning.

The spike in September sales makes October look more dramatic than it is.

Another spike in listings means more inventory for buyers to consider. One thing to note here is that about 26% of the active listings in Lake Las Vegas are listed by builders so they are either under construction or soon to be under construction. Given how long it takes for these homes to be completed and delivered, they may sit on the market far longer than a resale listing.

I have mixed thoughts about how to consider the above mentioned new construction listings. I’ve covered this topic in the past, but 26% of all active Lake Las Vegas Listings seems fairly significant. Determining exactly how significant is a bit of a challenge. They do represent competitive inventory for some resale homes though so I think it is important to consider which resale homes might be comparable.

Most of these homes are in the Rainbow Canyon area, which includes Del Webb, Reverie and Marble Mesa. The majority of these new construction listings are from Del Webb due to its size. It is competitive inventory in that the builder may be able to offer incentives that mitigate the cost of higher interest rates, but the buyer also has to wait for the home to be built to be able to close the deal and move in. Once under contract, the home might not close for months, whereas most resale homes typically close in 30 days or less. I think the number of builder listings and their time on the market skew inventory metrics, but that said, it is competing inventory.

Please keep the new construction listings in mind here. This represents all of Lake Las Vegas so it is a bit misleading as you will see below.

North Shore has perhaps the most diverse selection of homes including condos, modern homes and older Tuscan style homes. The majority of listings in this area are considered resale. Even though Marble Mesa Reverie and Amberock are nearby, they are considered part of the Rainbow Canyon area since they share the same loop.

The Falls has a lot of inventory that might compete with the new builds in Rainbow Canyon. In fact, Bellano and Varenna homes were built by the same builder and feature the same floor plans as Del Webb. This community also has its own slightly smaller pool of new construction inventory up in the Bluffs.

This is what I am driving at here. This number is a bit distorted. The build time for these new homes is driving some of this inventory. But you really cannot exclude the inventory because it does compete with resale. To compound this situation, Rainbow Canyon has some of the most expensive resale listings in Lake Las Vegas clocking in well over five million. These do not sell quickly. To truly know how long a resale listing in this area will be on the market, one has to zero in on the actual community and look at other resale listings. Even then, you cannot fully avoid competing with new construction, especially in Del Webb.

Then there is SouthShore. Yes, there are some larger homes in SouthShore but they sell and keep in mind at this price point most buyers are going to be cash buyers. Overall inventory is relatively low. Also note the diversity of homes in SouthShore. There are neighborhoods that have smaller homes that are attractive to buyers so this market isn’t completely dependent upon the sale of large custom homes. One word of caution though, SouthShore is a relatively small market so a few sales, or a few new listings can move the needle more easily.

Not much has changed here.

We saw a bit of a jump in cash purchases.

Final Thoughts

Inventory is a tricky thing to contemplate. The point of keeping track of inventory is to understand how that inventory competes. If a home or community does not compete with existing inventory it may have an advantage or represent a unique case that may or may not be advantageous. I wanted to dive into the inventory a bit because I think there is a tendency to look at it as a monolith rather than the nuanced notion it is.

Thank you,

Robin & Dave

Go back

Your message has been sent

Warning
Warning
Warning
Warning.

Lake Las Vegas Market Update

October 2023 Report

Holding Stable

Not much has changed since last month. The slight decline in sales price has become more or less stabilized. Some inventory improvements have also helped keep things stable.

Lake Las Vegas by the Numbers

As you can see the short term trend is still slightly negative, but September had a bit of a rebound suggesting some stability in the market.

Here is the long view. Average sales prices have increased steadily through 2022 and into 2023. The long term 10 year trend is similar though the increase in value towards the end was even more pronounced.

Go back

Your message has been sent

Warning
Warning
Warning.

We reached a new 2023 high in the number of closings. This helped shave off some of the excess inventory that began to accumulate at the tail end of Summer.

New listings cooled off quite a bit in September, while pending sales held close to August’s performance. The sales spike above combined with the reduced listing activity will likely keep inventory from expanding too much in the coming months.

Inventory held at 7.2 months. Although we had a sales spike, we didn’t quite get enough pending sales to move the needle. For Lake Las Vegas, this represents a fairly balanced market. This is for all types of inventory. If you want to see a regional breakdown please follow the link below to review the dashboard, which provides a similar graph for each section of Lake Las Vegas (The Falls, North Shore, SouthShore and Rainbow Canyon).

Inventory affects sales prices. Sales prices were just under 96% of list in September. This isn’t a bad thing, because those home actually sold, but it does indicate that there is enough inventory out there to create competition.

Despite rising rates, some buyers are still using loans. That said, I do think down payments have increased significantly. Also keep in mind that many of these sales are new construction inventory homes that were added to the MLS and some of those home builders offer significant incentives to use their in-house lender.

Final Thoughts

The listing surge has been offset by a sales surge. Prices are fairly stable, though buyers seem to be enjoying a bit more negotiation space. It looks like we’re headed into a stable Winter, but we’ll keep our eyes on the market.

Thank you,

Robin & Dave

Go back

Your message has been sent

Warning
Warning
Warning
Warning.

Lake Las Vegas Market Update

September 2023 Report

Cooling Off

Inventory keeps growing even as pending sales cool off. Is it a trend or an anomaly? I don’t know yet, but we’ll be keeping our eyes on it. Cooling off is to be expected in the fall and winter months and not because of the Earth’s axial tilt.

Lake Las Vegas by the Numbers

This is a rolling six months of data. There seems to be a slight downward trend.

Home sales are still holding their own. We may see a bit of a dip as we head into the slower fall/winter cycle.

Go back

Your message has been sent

Warning
Warning
Warning.

We had quite a spike in new listings and a dip in pending sales. Listings tend to slow down in fall and winter, as do sales, so this is more likely a trailing effect of listings that were in preparation during the peak of the hotter spring and summer sales period. I expect to see a less extreme gap in the coming months.

Sales prices are still holding near the 97% of list area. Buyer’s, this means you have a good 3% of potential negotiation space. Seller’s, rest assured you still have room to make a decent return. You just need to figure out where you want to live.

Loan Vs. Cash. We’re still in the 50% zone. Cash might go up if rates continue above 7%.

New inventory plus fewer pending sales equals more inventory. We’re still reasonably close to the balanced market zone, but we’ll keep an eye out for inventory spikes or sales slumps.

Final Thoughts

Things are cooling down a bit. Some of this is normal seasonal shift, but some of it is likely a market shift in response to continued high interest rates. We’re keeping our eyes on it, but ultimately, there is still quite a bit of equity out there so sellers are in decent shape. That said, the slowdown in buying activity will mean sellers should expect more time on market before getting a reasonable offer and they should also expect some negotiation on their list price.

Thank you,

Robin & Dave

Go back

Your message has been sent

Warning
Warning
Warning
Warning.