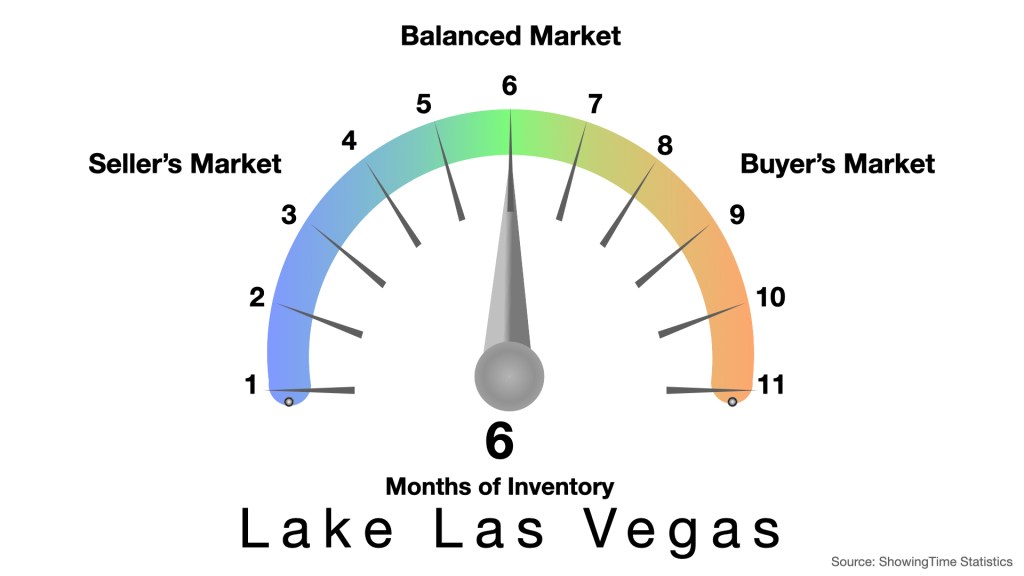
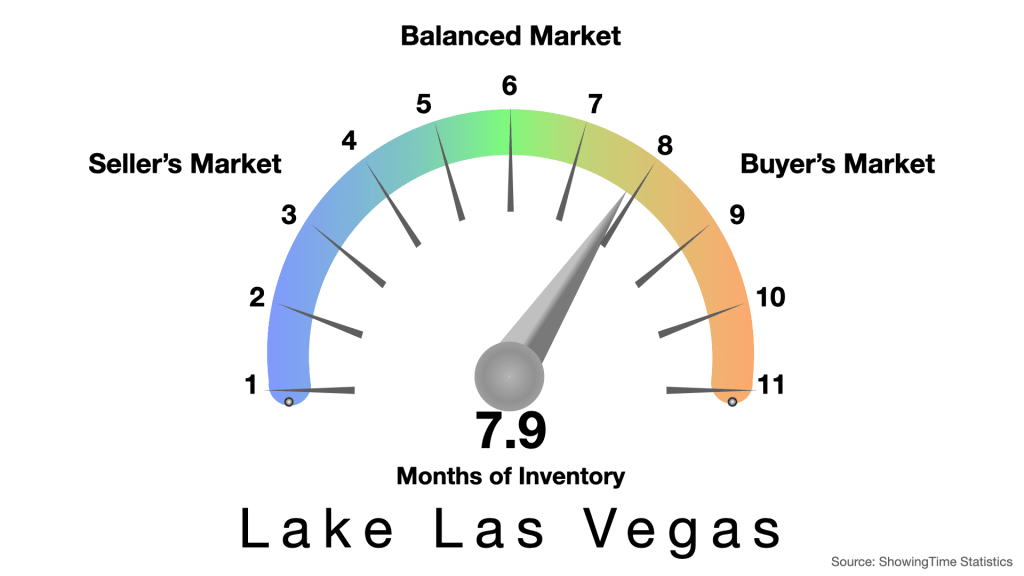
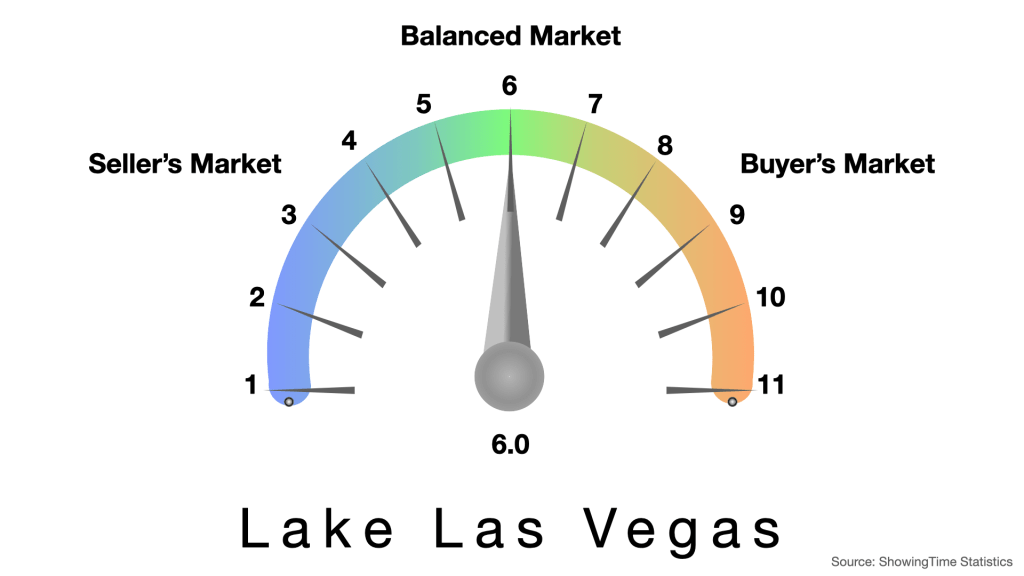
It’s already August and the market is balanced. Balance is a good thing. Balance means stability. Home sellers are hoping for continued appreciation, but home buyers are looking for value. Balance means both parties are getting what they want. I’ll explain below.
Lake Las Vegas by the Numbers
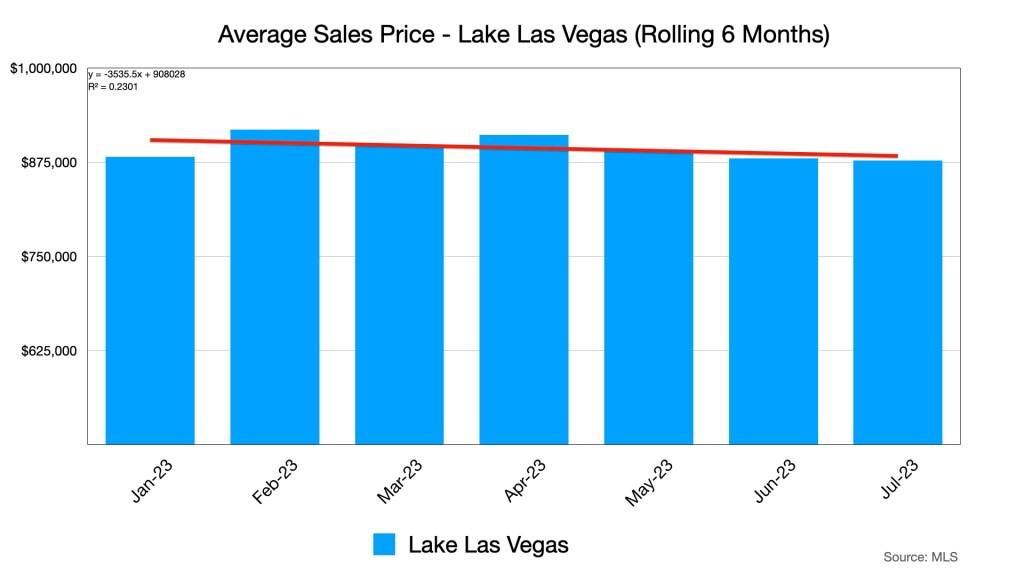
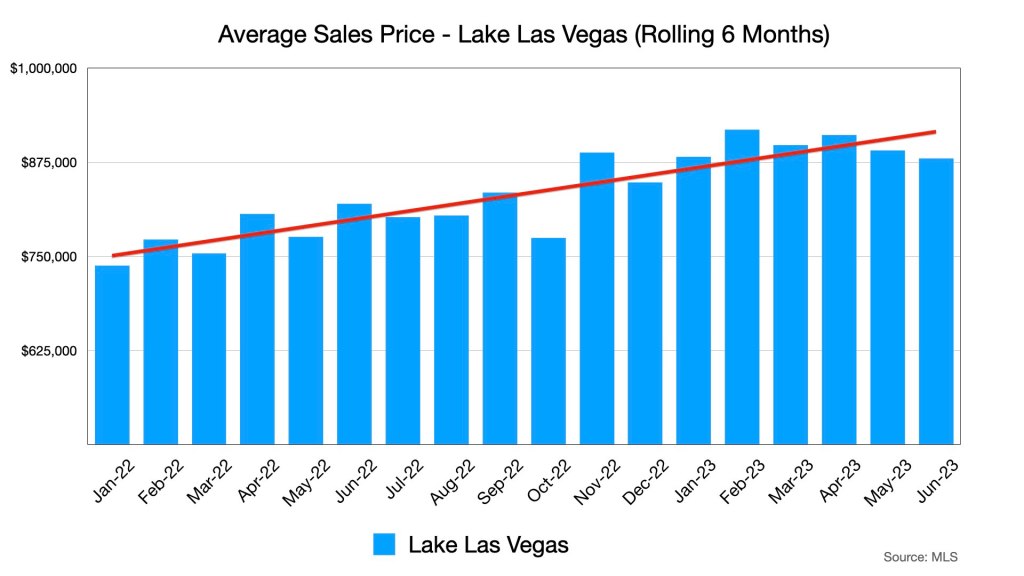
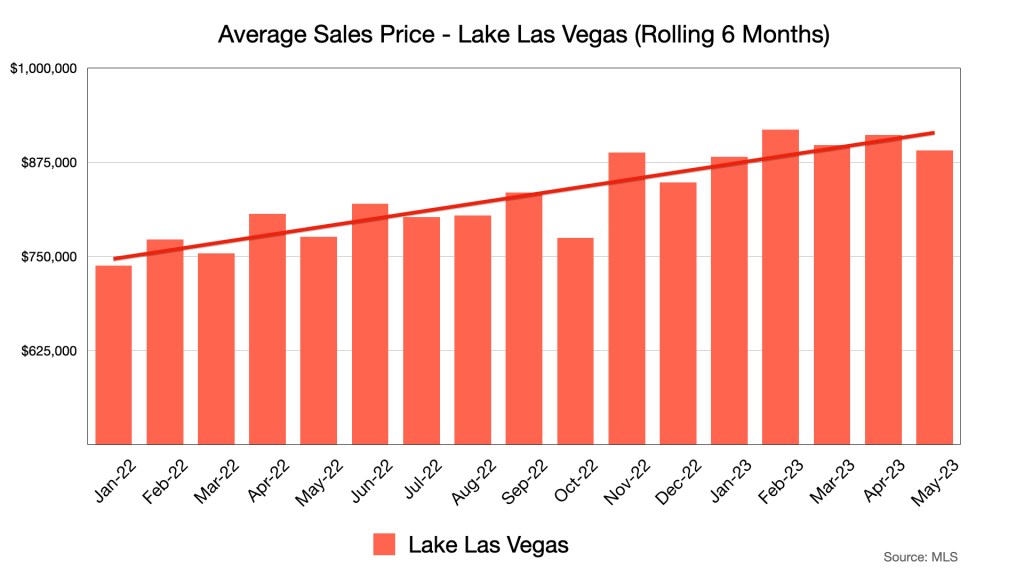
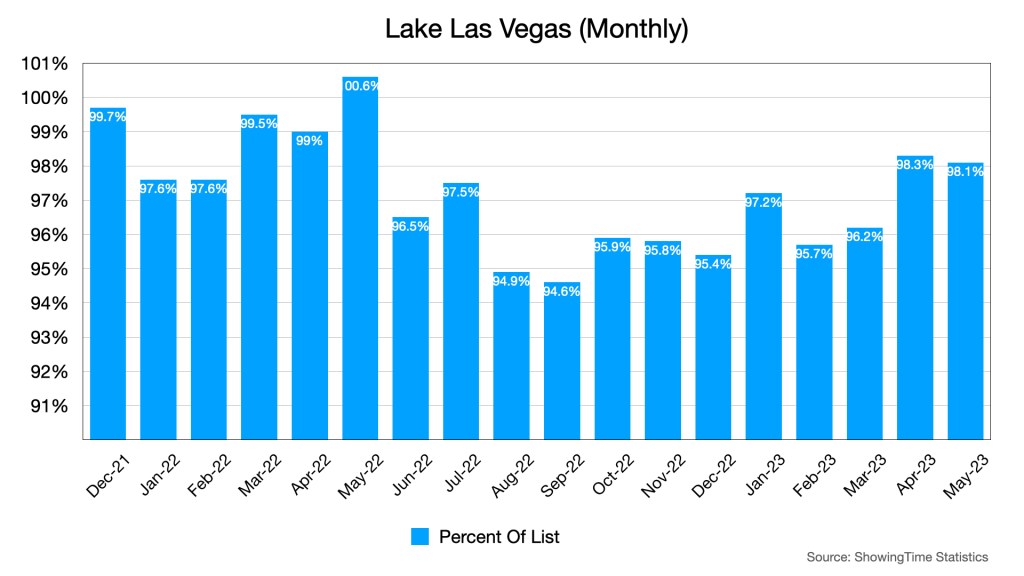
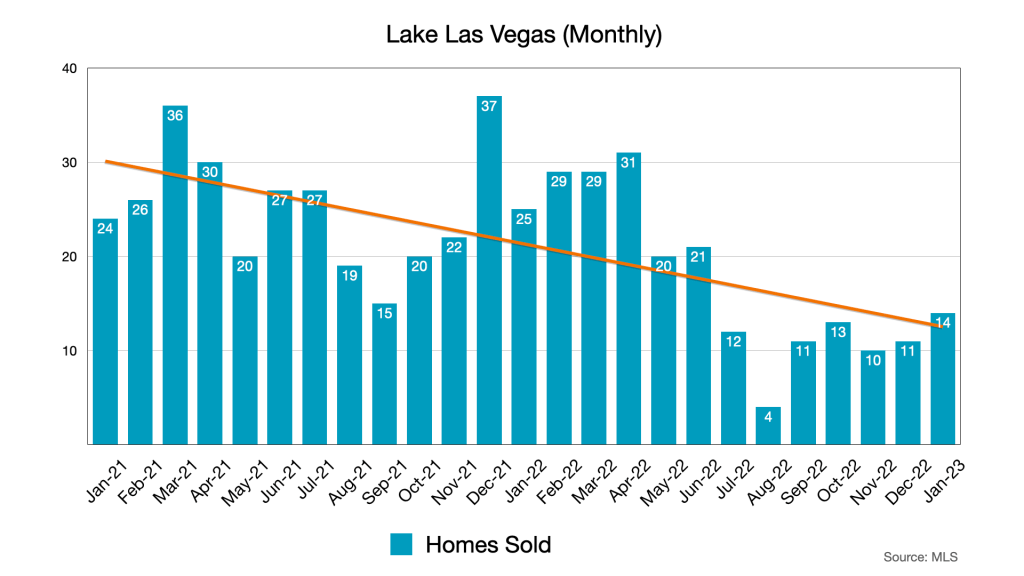
The trend line here suggests prices are on the rise. It’s a bit of a statistical lie. Prices have risen, this much is true, but this is a chart that covers nearly a year and a half of sales.
This is the first seven months of 2023. The trend line is flat, or leaning negative. I don’t think it is possible for a trend line to be perfectly flat. Normal variability forbids a perfectly flat trend line. If you are a potential home seller looking for appreciation it is to be found in the previous chart. This chart is showing you that the 19% market appreciation from the prior chart has been locked in for the past seven months.
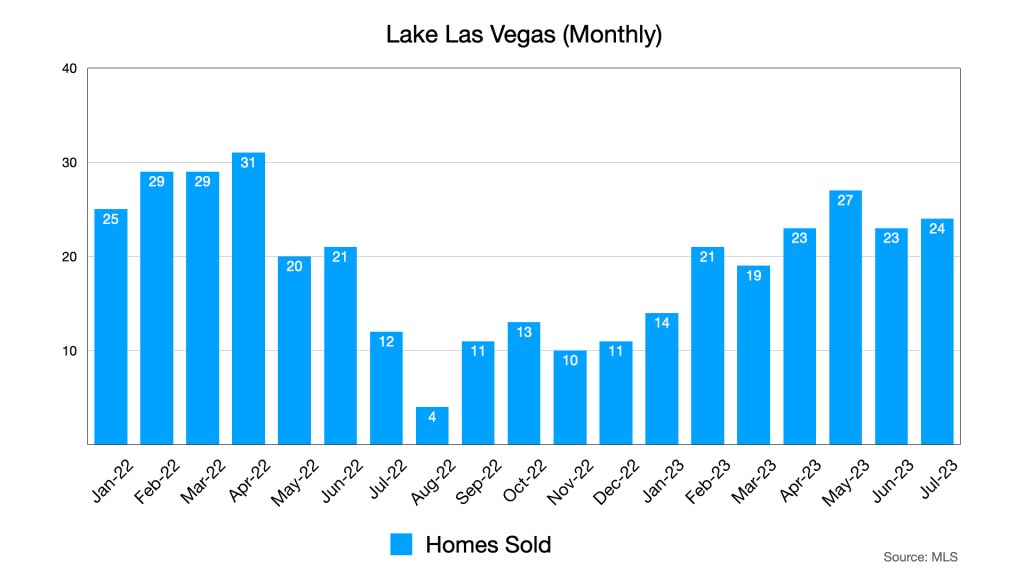
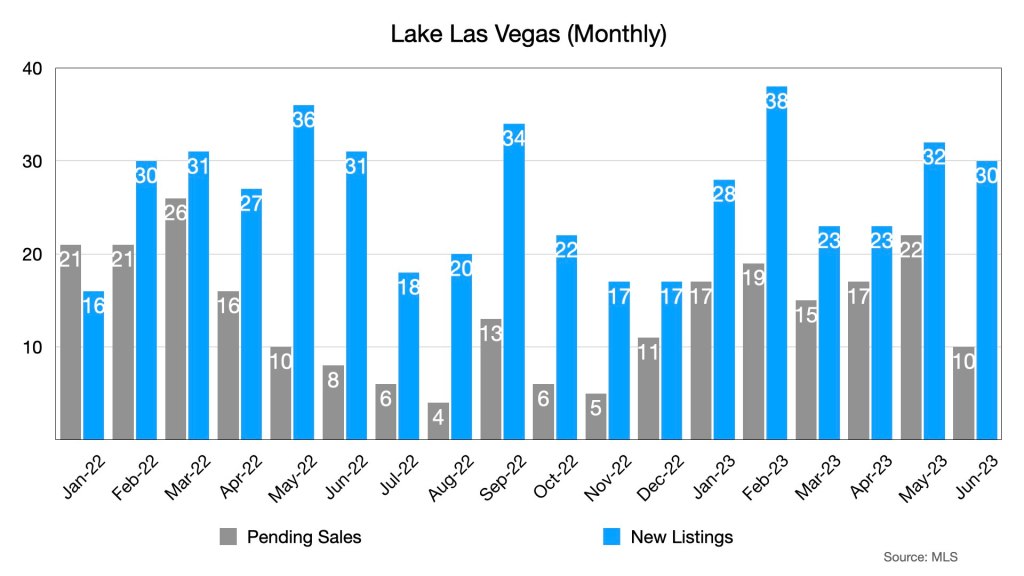
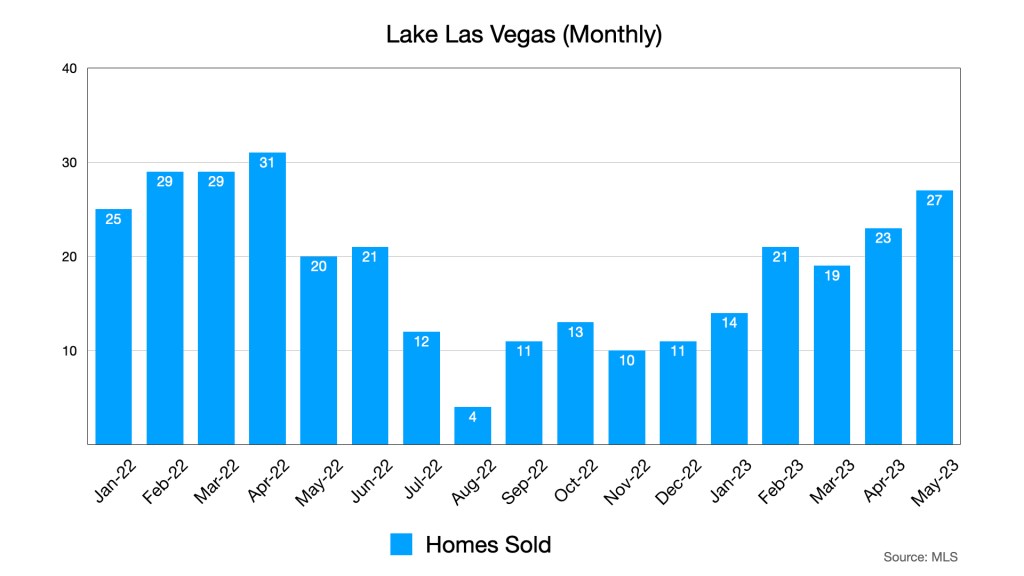
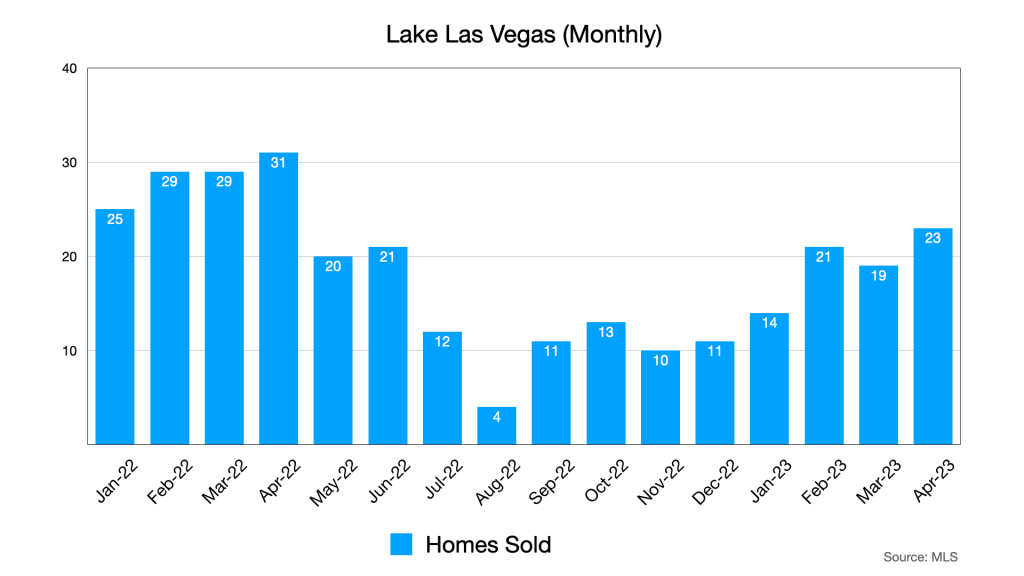
We’re still holding steady with a decent, but not record breaking pace of around 25 sales per month. The majority of these sales represent home sellers who have benefitted from the rapid appreciation that occurred over the past few years.
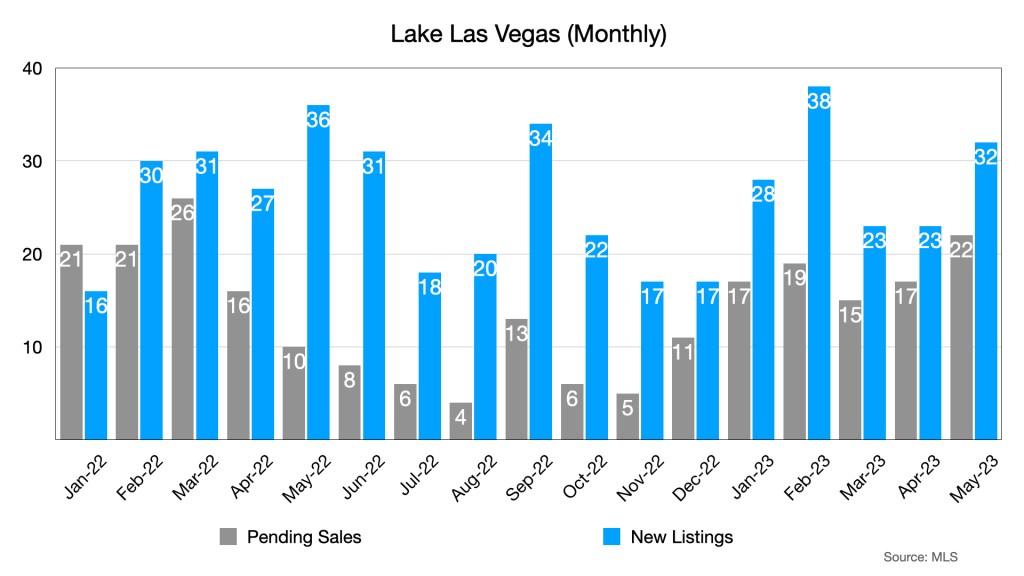
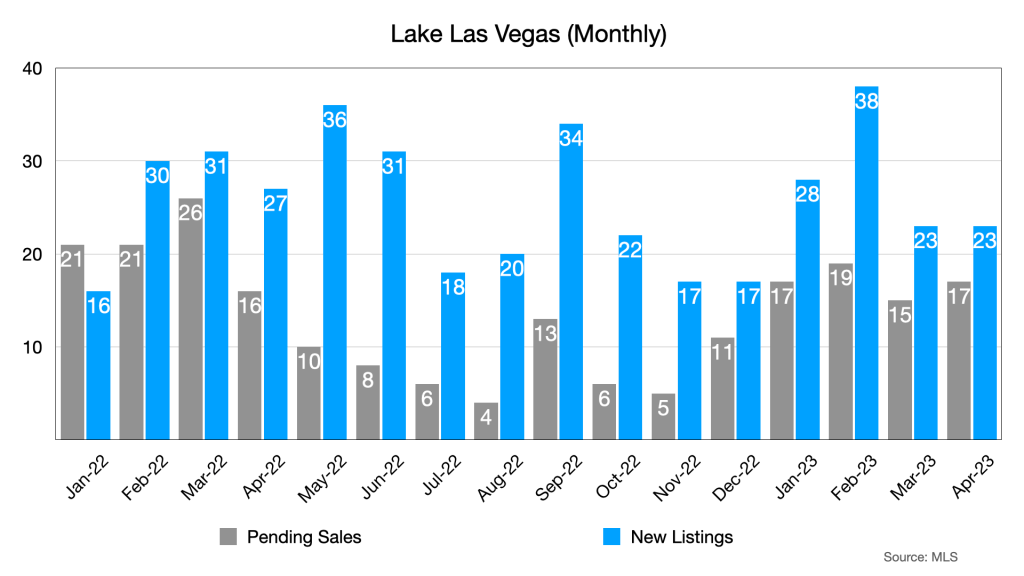
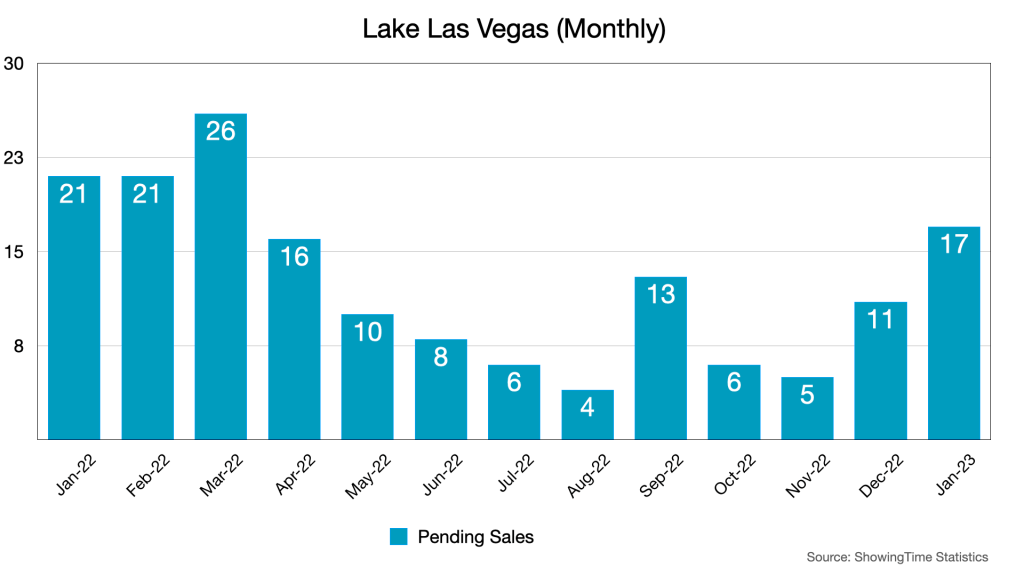
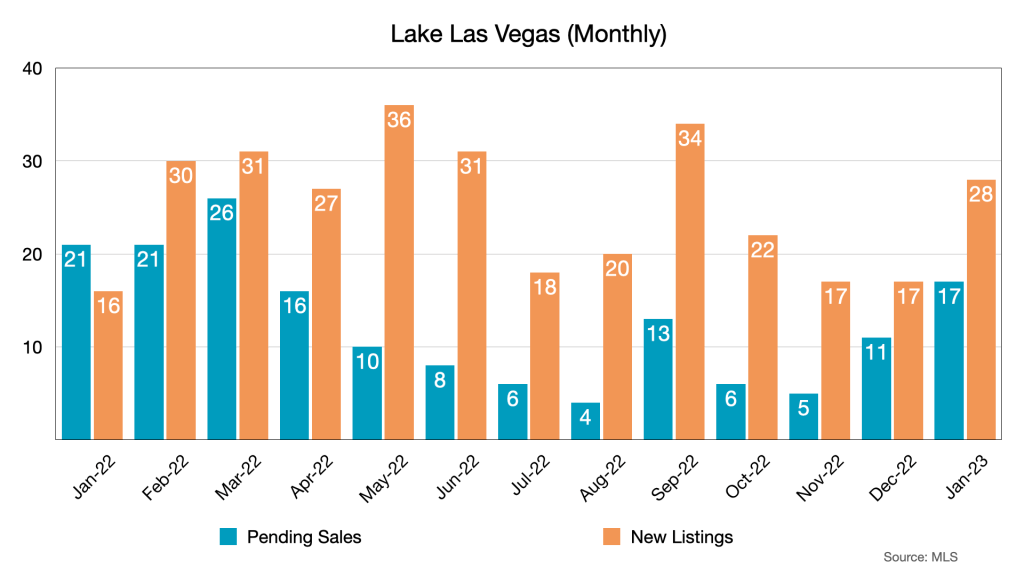
With the exception of June, we’re starting to see pending sales closing the gap with new listings.
This is my point in one chart. Buyers feel confident they can negotiate and find value and sellers know they are going to take home a decent net at closing. A balanced market is a comfortable market for both parties.
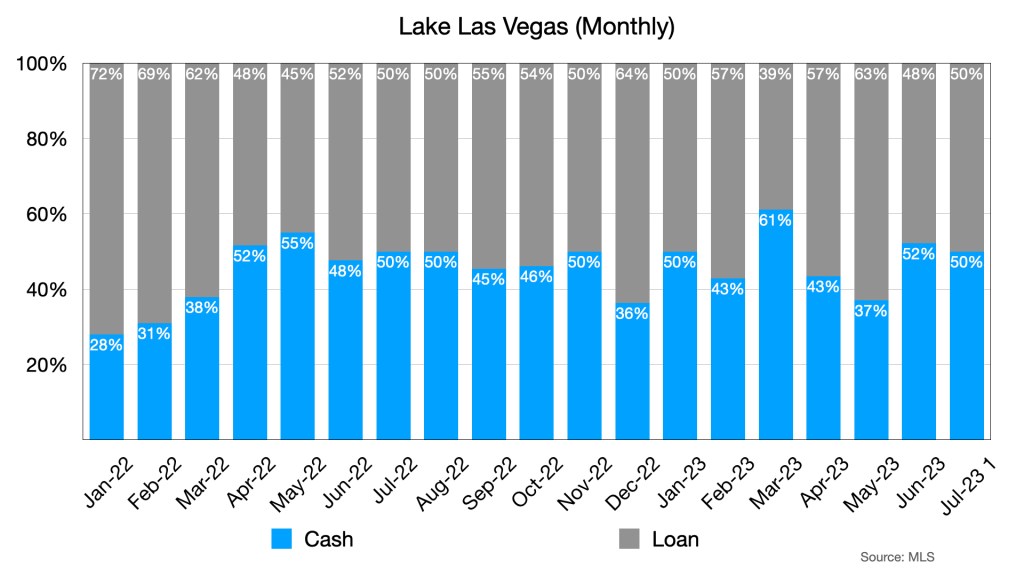
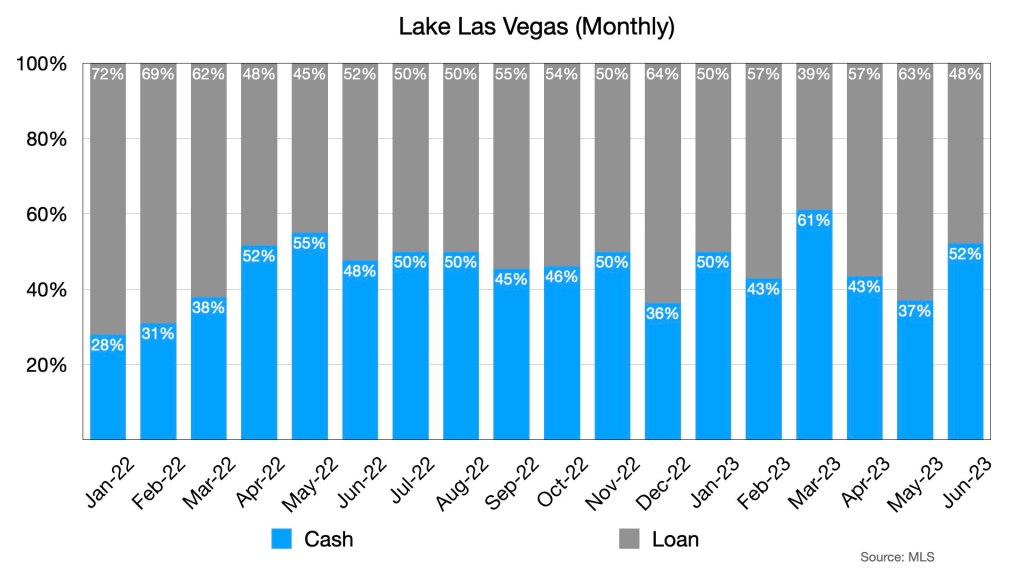
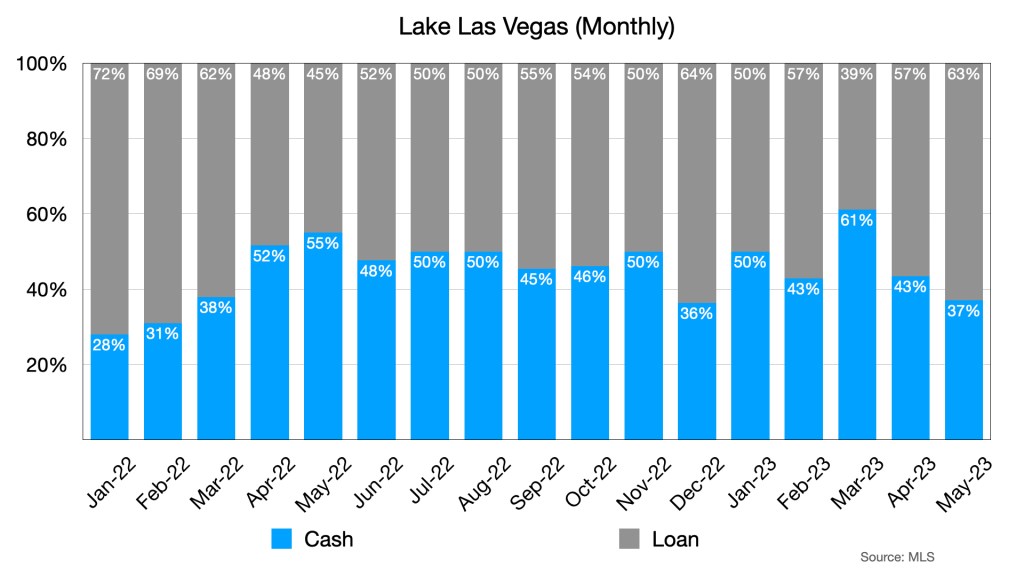
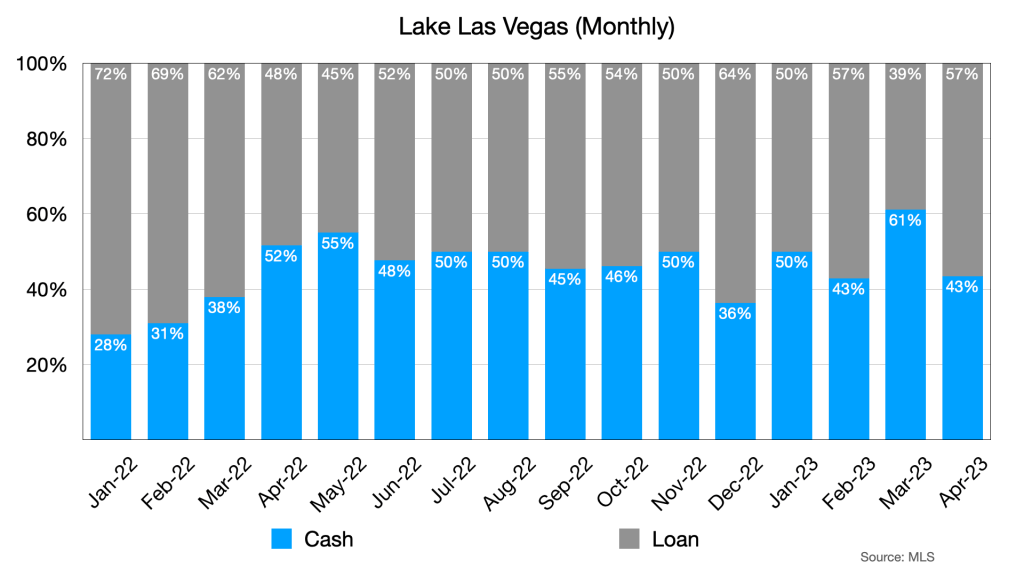
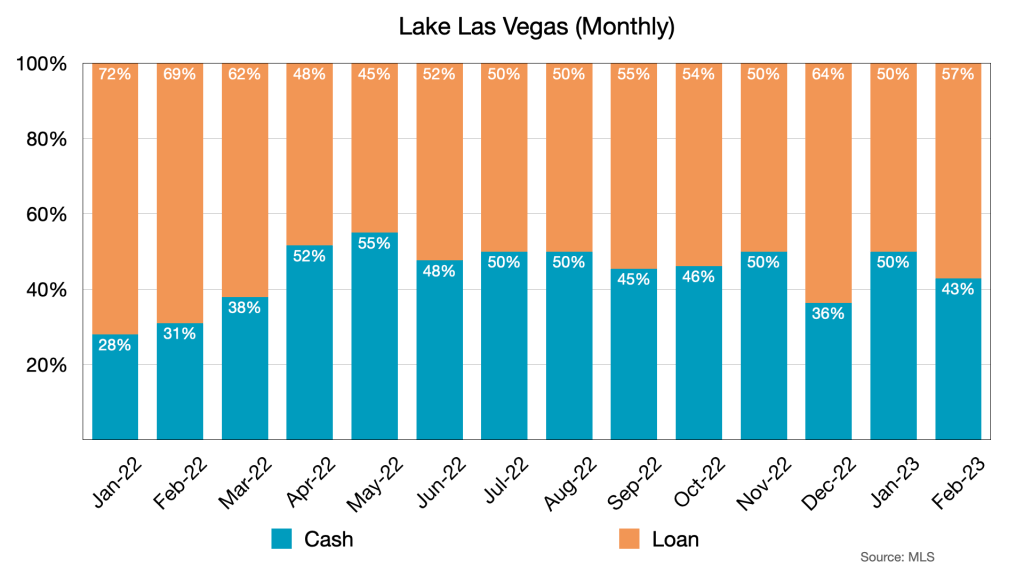
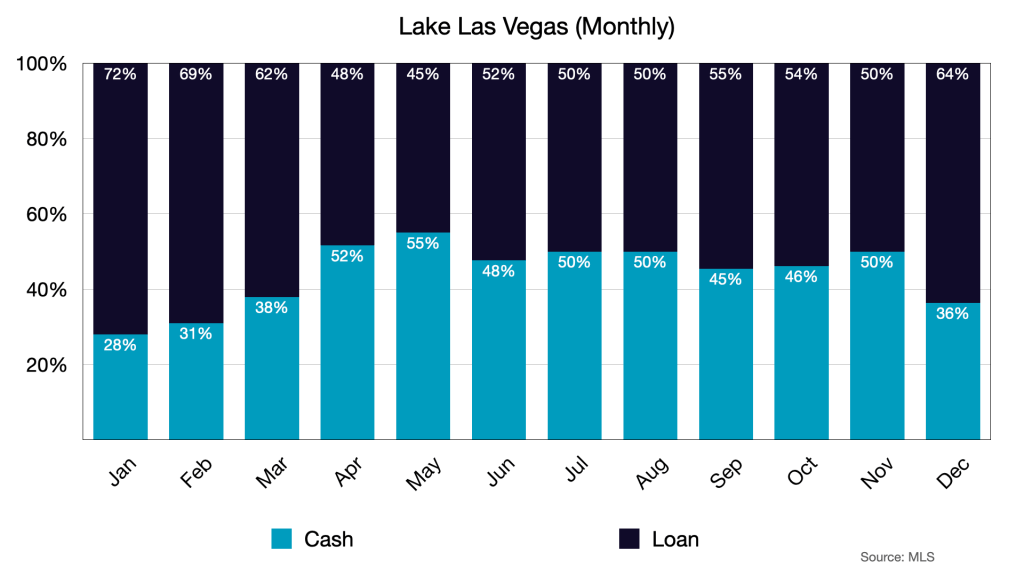
Cash is still hovering around 50%, but as I have mentioned many buyers who utilize loans make very large down payments to keep their loan payments reasonable.
As I mentioned above, a balanced market is a comfortable market. When we were seeing rapid price appreciation in 2021 and 2022 we also saw fed up buyers walking away from the market. Those buyers may feel more confident now that they have some ability to negotiate. Sellers need not fear negotiation. The home value appreciation of the last decade has made it possible for many sellers to come away with a decent net and they can get it because there are confident buyers out there.
It’s hot outside. The local Lake Las Vegas Market is maintaining its pace and perhaps showing signs of leveling off in terms of sales activity. We’re also approaching fall.
The upward price trend is holding with some normal variability. We are however starting to see a plateau for the first half of 2023.
Four fewer sales from May to June does not necessarily make a trend, but we can watch to see if it becomes one over time. That said, June, July and August typically show a bit of a plateau in sales and listing activity anyway. The lockdowns shifted the market cycles a bit since they started in mid March 2020, but that shift has slowly returned to normal.
Pending sales dropped in June while new listings held. Keep in mind that part of the seller’s decision to sell involves recent sales in their own neighborhood so there is a natural lag between a slowdown in listing activity and sales activity. The decision to sell is based on past sales.
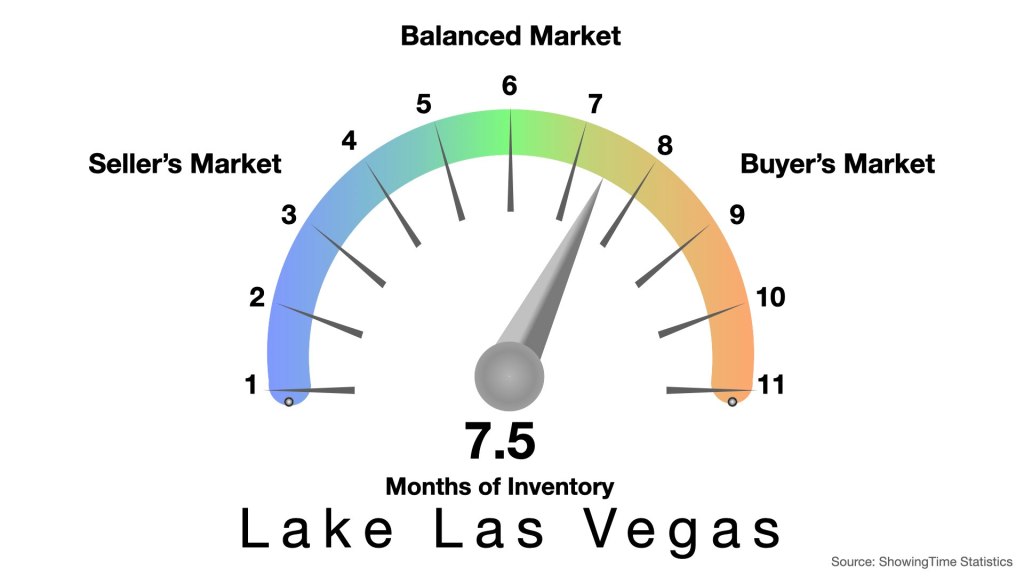
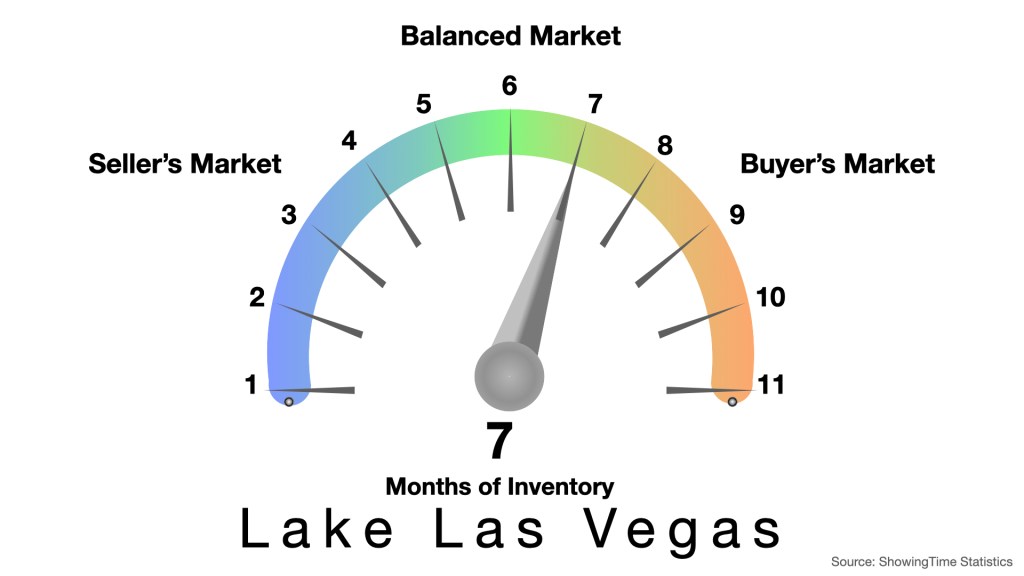
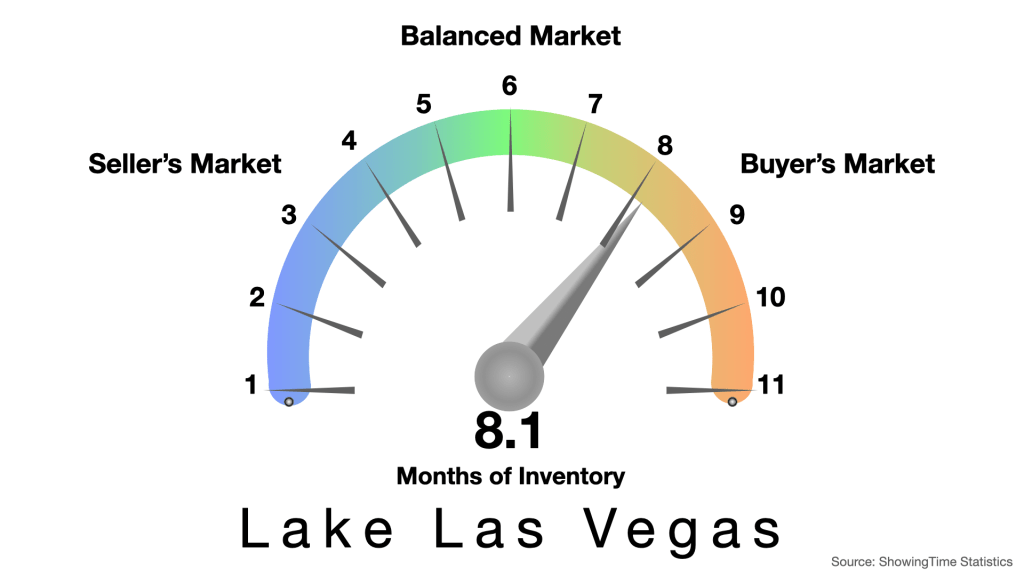
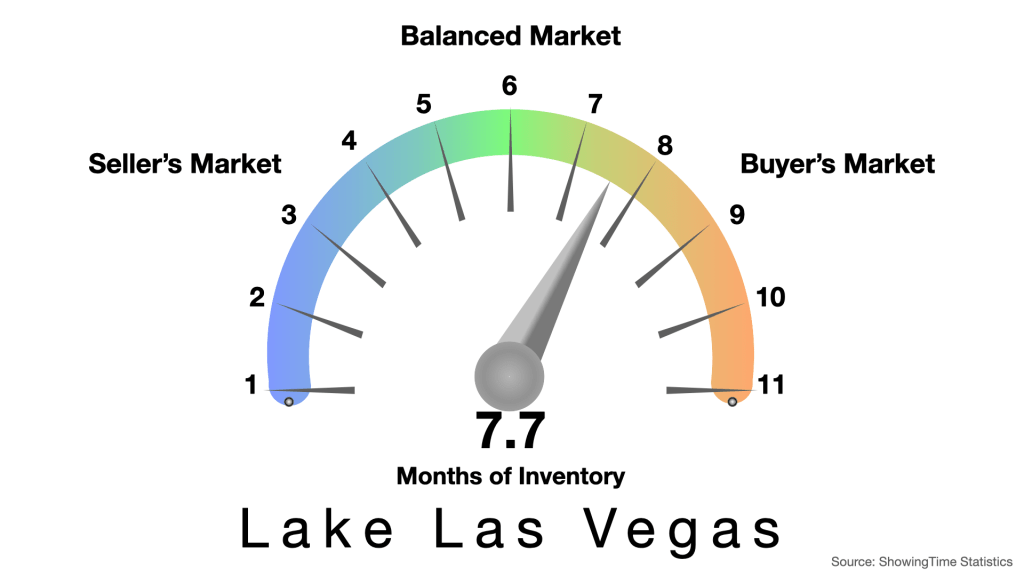
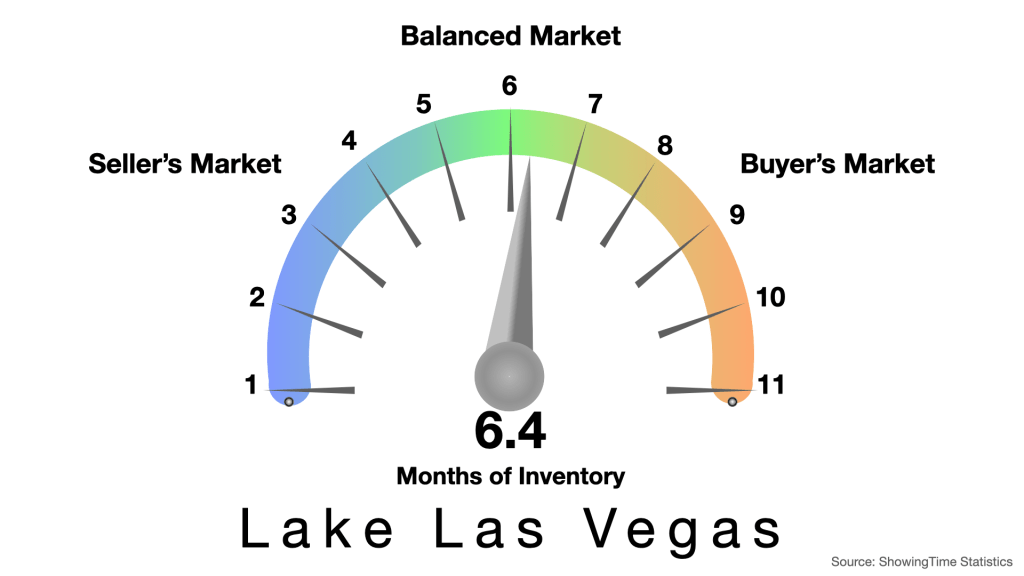
We’re still hovering between 7 and 8 months of inventory. Some regions of Lake Las Vegas are higher or lower than this, so you can check the details on the dashboard. This covers all properties in Lake Las Vegas.
Things are holding steady. We’re heading for a natural plateau period in the market so this should not come as a surprise. Beginning in August we may see a normal decline in both listing and sales activity. This does not mean prices will decline as well, in fact, lower inventory could boost prices if not hold them where they are.
May saw a nice uptick in total sales so some of the accumulated inventory was trimmed back. There’s a bit more to the story as you’ll see below.
I do make an attempt at analyzing price reduction trends but it is more complicated than it seems. The trend for this data is not clear and I don’t know that there is much to see here, but it is worth exploring.
The upward price trend is holding with some normal variability.
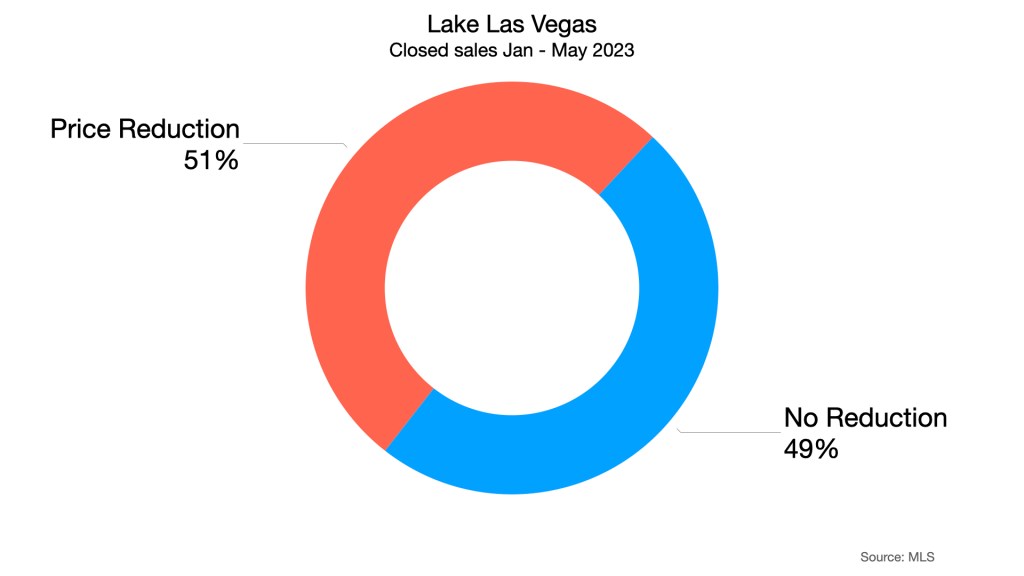
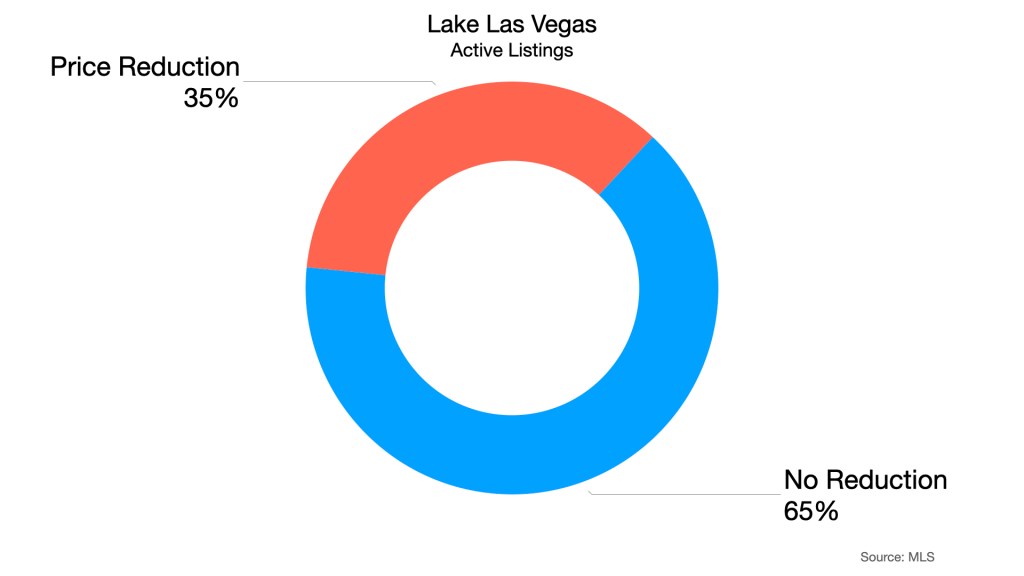
Anecdotally, we are still seeing price reductions come through our daily feed. This chart shows price reductions for homes that have closed since January 2023 to the end of May. Obviously, the prices were reduced while they were still active and analyzing exactly when they were reduced is a challenge with the available MLS data. The average reduction for these listings was -4%. Please keep in mind that price reductions are a normal part of the home selling strategy, so it is difficult to infer any sort of market shift here.
This is the same information, but for Active Listings. Some of these listings are younger than others so they may not yet have come to the price reduction crossroads. I prefer the data for the closed listings above, because it covers the entire lifecycle of the listing. And since they closed, we can safely assume they eventually discovered a price the market will bear.
We are continuing our slow upward trend in monthly sales. We’re getting close to the highs of early 2022 which represents the time just prior to the shift in activity caused by sudden interest rate increases. Mortgage (purchase) applications had a slight decline starting in early May. But June is looking up so far.
There was a bit of a jump in new listings in May, but also a slightly smaller jump in pending sales. The increase in sales seen above has helped reduce inventory, at least a bit.
We were at 8.1 months in April, we’ve gone down to seven for may.
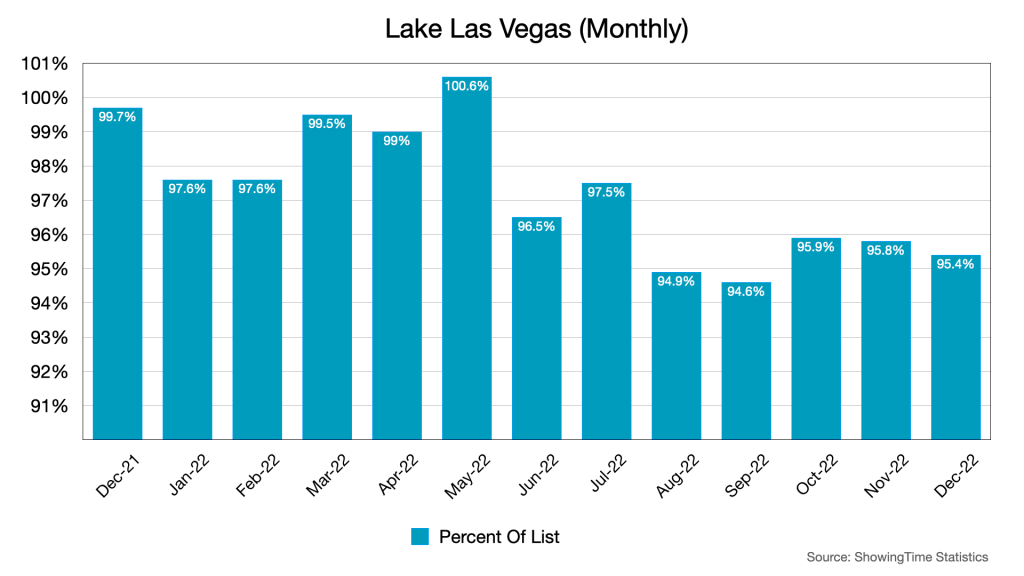
Sales prices are still holding tight to list price, but smart price reductions might have helped.
Please, I beg you, don’t spend too much time contemplating the price reduction charts. They are interesting to explore, but also, more complicated than they look.
It was good to see an increase in sales that actually moved the needle on the month’s of inventory chart. It was also good to see that offer prices remained close to list for another month. Things are starting to look closer to a normal Lake Las Vegas market again.
We invite you to leave your thoughts in the comments below.
Not much has changed from March to April. There has been some inventory accumulation, but the pace of sales and new listings hasn’t really changed at all, which is why some inventory has accumulated.
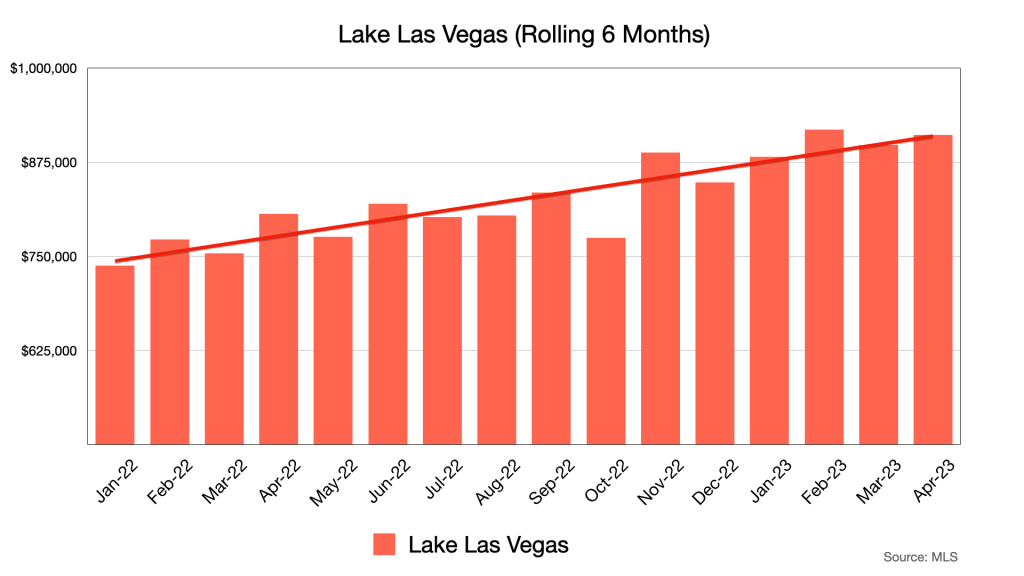
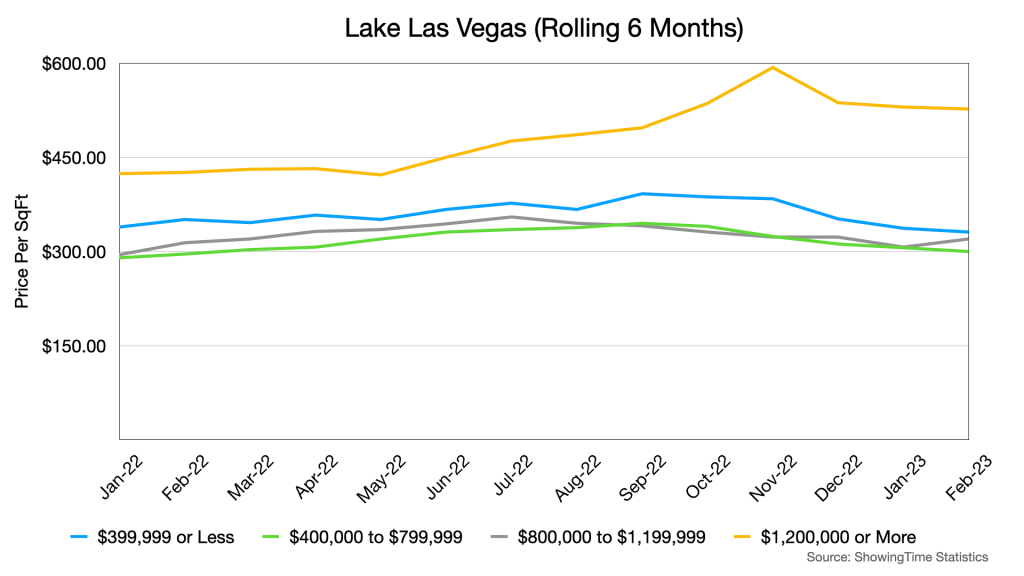
This represents all of Lake Las Vegas, properties on a rolling six month average so that we can see the trend through the month-to-month noise. The trend is still up. The thing to keep in mind here is that Lake Las Vegas has a wide range of homes that sell for a wide range of price ranges.
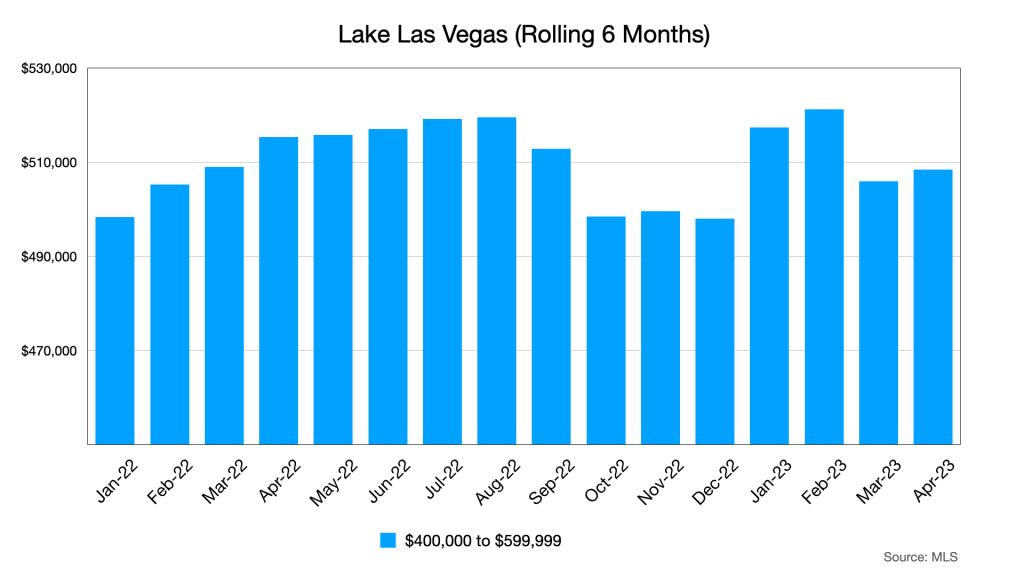
This is the same chart as above but isolated to the $400,000 to $599,999 price range. Notice the dip starting in September 2022. This is about how long it took for the interest rate hikes of that era to affect the local market. In this price range, conventional loans are more approachable to most buyers.
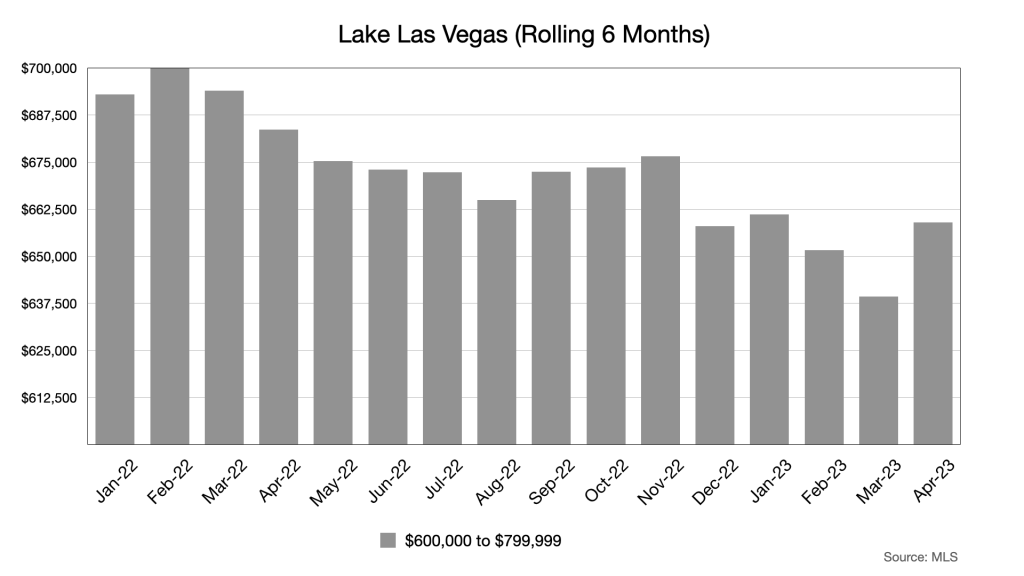
Same chart still, but now we’re looking at the $600,000 to $799,999 price band. The downward trend from September never really corrected all that much, like it did in the $400K-$599K chart above, but there was a nice uptick in April 2023. Conventional loans are still an option for this category, though they are most useful at the bottom of the band due to the max conforming loan limit.
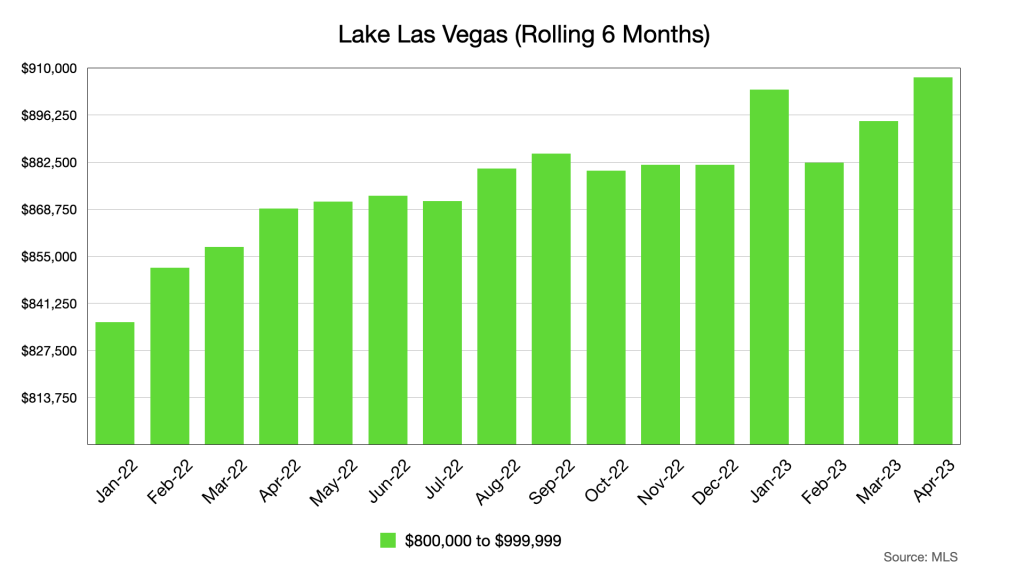
Now we’re into the $800K-$999K band. I’ll first point out that there aren’t as many sales in this price band as compared to the previous bands. That said, there is certainly enough data here to show a clear trend. We’re now looking at buyers who are able to weather short to medium term interest rate hikes or put out enough cash not have to worry about loan payments.
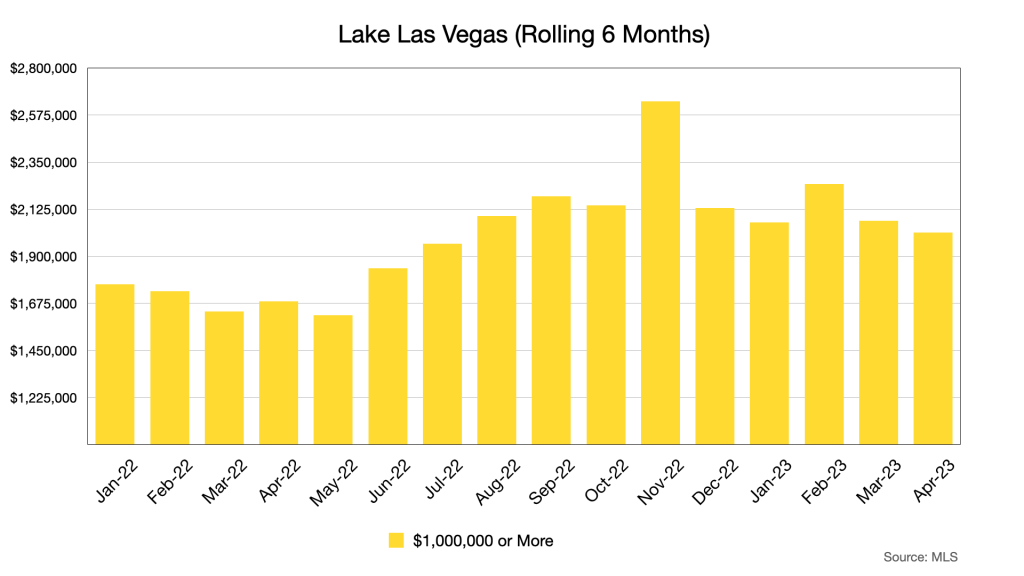
This is the million plus category. I’ll add the same caveat as I did above. This chart doesn’t represent a huge sample of the sales in Lake Las Vegas, but there is still plenty of data. The two bands that represent the $800K to $1MM+ price range obviously have little correlation to interest rates, in fact there may be some long term investment shown in these bands due to the volatility of other types of assets like stocks and bonds.
In the cash vs. loan breakdown, we can see another dip for cash, or if you prefer, another spike for loans. Here is an interesting correlation. Starting around March 1, 2023, mortgage purchase applications began to rise right around the time interest rates began to fall slightly. That spike in applications peaked around April 10th and then dropped a bit thereafter.
Homes sold remains in the low twenties for April. Nothing much has changed here, but we’re keeping our eye on it. A spike in sales would help shave off some of the accumulated inventory.
New listings and pending sales was also flat with new listings outpacing pending sales at about the same ratio as March. This is why we are accumulating inventory.
Inventory is at 8.1, up slightly from 7.9 months of inventory.
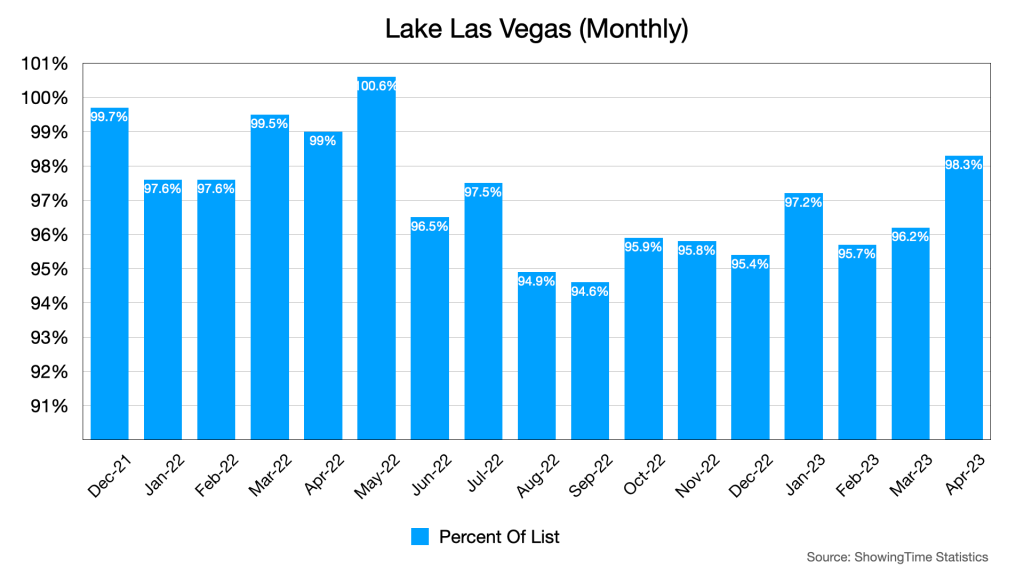
Once again, we see a nice uptick in the percent of list metric. As I’ve stated before, some of this might be the result of more informed list prices, but some of it is almost certainly buyer demand driven. Lake Las Vegas is comprised of many different and unique communities. Just because there is 8 months of inventory available doesn’t necessarily mean all of that inventory is competing with each other.
For more Lake Las Vegas real estate market data, click on the button below to access our dashboard.
There’s not that much to say that hasn’t already been said above. The top end of the market is seeing some price performance but overall, things are moving along at a modest pace.
We invite you to leave your thoughts in the comments below.
This is going to be a short post. There isn’t much to cover or analyze that hasn’t been discussed in the last report and nothing much has changed since then. That said, we think this is a good time to reflect on some basic truths about real estate. These truths sometimes get overlooked in the hype and noise of the news and all of the commotion about interest rates and such, so let’s talk about them and why they matter and then we’ll go over the numbers.
Truth #1: Real estate is local. It is so local that even a multi-billion dollar company with advanced pricing algorithms can’t figure out how much your home is worth with a satisfying degree of accuracy. We’re talking about the Z word website that shall not be named. This is why we focus on Lake Las Vegas. You can wander a half mile away from this community and have a completely different housing economy. That and because we live here. Smiley Face Emoji.
Truth #2: Real estate is global. Yes, yes, everyone has to live somewhere, yada yada. Yes, we yada yada’d the idea of basic shelter. This is not what we mean when we say real estate is global. The truth is, because everyone needs it, and because it cannot be moved even a little bit, it has intrinsic value. It is not a commodity like gold, because you can live a decent life without ever touching so much as an ounce of the stuff, but life becomes much less viable if you don’t have shelter. You might be tempted to think that we’re isolated from the global real estate market because your home is where it is and it isn’t going to China any time soon, but China can certainly come to your home. Literally. I’m talking about Chinese home buyers.
Truth #3: Real estate is an investment. So, as a real estate agents, our names and phone numbers are everywhere. We’re fine with this, we want to be found. Our phone numbers are 702-858-8833 and 702-592-0679, call us if you want to buy our sell a home. We get a lot of calls though, some of them from people trying to sell a warranty on a car we haven’t owned since 2007, but many are asking if we have any potential “Flip” homes coming onto the market. We don’t know how these people are making money. We’ll not get into the upside down economics of flips in this market, but we feel bad for the people who call, because our answer is always “no.” We bring up flippers because that is what most people imagine when they hear us say that real estate is an investment. It is more than flipping. Real estate, including residential real estate generally appreciates over the long term. There are dips along the way, so you have to be patient and be able to hold out through those dips, but it usually holds or appreciates in value over the long haul. Some investors collect rent, other’s just buy a five-million dollar vacation home at the lake and sell it when they are ready.
The local market here in Lake Las Vegas has some unique characteristics that cannot be replicated easily. These unique characteristics are attractive to investors, because they are attractive to people looking for a nice place to take shelter from the world. That is the theme here, because all else being equal, not much has changed since last month, but we’ll go through the numbers anyway.
Lake Las Vegas by the Numbers
When we say real estate generally appreciates over time, this chart is what should come to mind. You don’t even have to use Lake Las Vegas to recreate this chart (with different numbers, but the same approximate trajectory), any market will do. This is a 172% appreciation over a decade. Now, before someone from the government gets upset at us, we’ll say that it is not quite so simple as buying and then waiting ten years to make a 172% on your investment. Ask the investors who bought in 2006-2007 what we’re talking about and then duck.
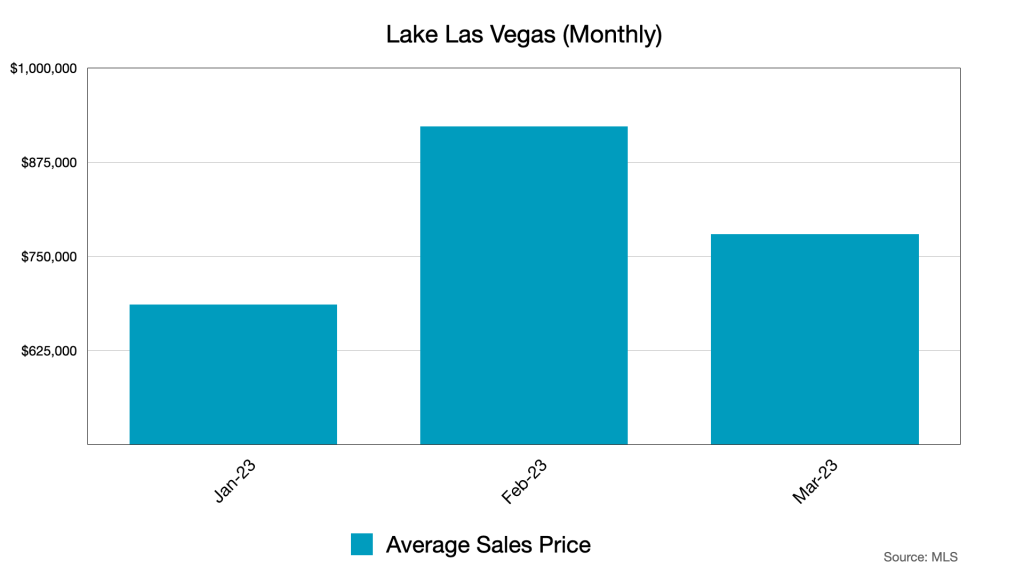
These are the monthly averages for the first three months of 2023. It’s hard to see a trend here because there isn’t one. These are just how the sales of these three months averaged out. Averages are not special, they are just average.
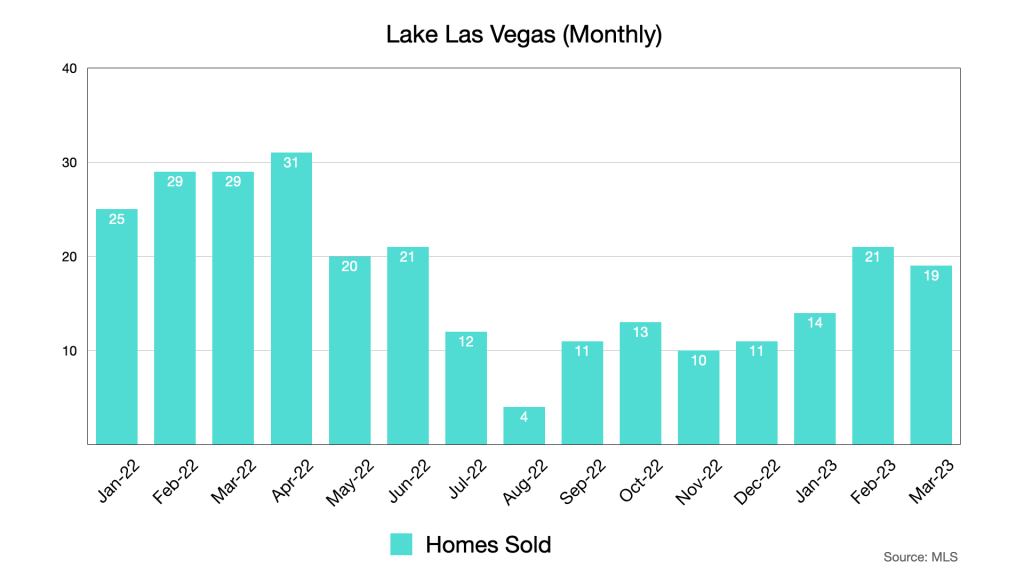
These are the raw sales numbers from the MLS, they are not averages, just numbers. We’re leveling off a bit in sales activity, but this is a stable market. Some of the low volume in the winter months are to be expected due to seasonality of the market, but they are still lower than normal.
Pending sales are still hovering in the high teens and listings, while lower for March, are still outpacing. This isn’t unusual for Lake Las Vegas since the higher than average price point means most homes take longer to sell anyway.
Inventory went up a bit from February’s 7.7 level, but there really isn’t much of a change here. Historically, Lake Las Vegas tends to land in the 7 to 15 month range so we are not in unusual territory here. Some buyers, however may see opportunity on this chart. This is the type of gauge chart their agent is going to show them, or at least attempt to explain to them when they go out looking for a deal.
We linked to this report last month, and we’ll link it again, because it goes to our point about truth #3. Investors are looking to residential property even more than they are gold for a safe haven investment. The linked report is from Knight Frank, Douglas Elliman’s global partner. It is extremely detailed. We’d also note from that report, that sunbelt areas are popular destinations, especially if they are resort destinations. Mix in some seriously pent-up demand for foreign investment in U.S. real estate and you have some potential demand growth coming down the road.
Here’s the latest cash vs. loan breakdown. Cash is up again. It might go down again due to the low rates we saw in March. Imagine coming from the other side of the planet with all of the money you had planned on investing during the pandemic, but couldn’t and you’ll see why I continue to look at this bit of data.
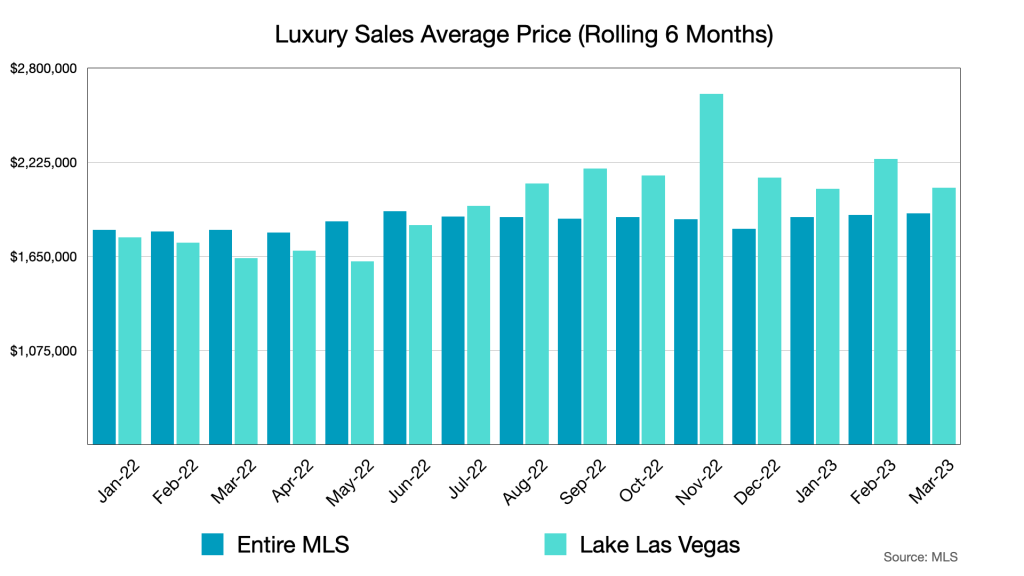
Now consider truth #1 from above. There are luxury ($1MM+) homes across the valley, but not all of them have a lake. Lake Las Vegas has not always performed this well in the luxury market for reasons that are hard to pin down sometimes. Properties on water are attractive to luxury buyers, and therefore to luxury investors. Throw in golf and resort amenities and you have a recipe for a great luxury community worthy of investment.
For more Lake Las Vegas real estate market data, click on the button below to access our dashboard.
We are seeing modest listing and buying activity. Will we see a sudden surge in investor activity? Probably not sudden, but it is something to watch. If Jay Powell does anything to Fed rates, just know there are about a million people who’ve been watching him to see how he eats a ham sandwich in case it is informative on his larger market and banking philosophies. Big bites, small bites, we’ll see, but we don’t think the rate changes will be much of a psychological shock to the market going forward, if anything, there is potential for less aggressive Fed action, if not outright cuts by the end of 2023.
We invite you to leave your thoughts in the comments below.
Towards the end of 2022 and through January of 2023, we had seen average interest rates level off at a still high, but relatively more acceptable range between a high 5% and mid 6%. This relative decline from the summer highs, plus relative stability in rate fluctuations helped improve buyer demand as evidenced by a couple of modest spikes in mortgage (purchase) applications (you will need to scroll down to the purchase application chart on this link and possibly zoom in on the last few months to see these changes). This relationship, buyer demand rising as interest rates decline, obviously works the other way, and so we saw a slight decline in applications as rates spiked after the last Fed hike. But that is not the whole buyer demand story. That initial spike in mortgage applications still has some room to run because it can take a few months to find and close on a suitable home. So some of those potential buyers are still out there and they are driving us into Spring.
Some home builders are now offering to pay for rate buy downs, effectively bringing a buyer’s interest rate down to a more comfortable level. Same holds for sellers on the resale market. Knowledge of how interest rates work has not been a topic of serious consideration for most home buyers for a very long time. Now that higher rates are affecting affordability for more people, they are getting educated. People realize that the Fed is trying to push interest rates to help bring down inflation. In other words, it is a short term game. Equity and bond market players have also gotten comfortable with the notion that Fed hikes will likely react to key inflation metrics and they have priced these possibilities into their portfolios and investment strategies. This is all to say that rates are now fairly predictable because market actors are better at anticipating Fed policy. Predictability breeds confidence.
Keep in mind that Lake Las Vegas attracts more cash buyers than most markets in the area largely because of the higher price point and because it attracts vacation and second home buyers who tend to be more affluent folks. As you’ll see below, there is a bit of opportunism built into the decision on whether to take a loan or pay with cash that cash capable buyers may be willing to consider if the circumstances are right.
Lake Las Vegas by the Numbers
Lake Las Vegas had a good month for prices, but much of this improvement was driven by some high value sales in SouthShore. Click here to explore that sales data in more detail.
I’m generally reluctant to break down data from an already low number of sales into smaller segments, but I think it is important to understand that the Lake Las Vegas real estate market is not a homogenous market. I’ve broken the market into price bands. As you can see, the top price band, $1.2MM+ is outperforming all other price bands. The latest jump for this band at the end of 2022 has held more or less stable into 2023. The top two bands are both well above the maximum conforming loan limit of $726,200, which means one has to either take a Jumbo loan, make up the difference in the down payment, or pay cash to buy a home in these bands.
Pending sales stayed even, but new listings jumped once again in February. Anecdotally speaking, showing activity is on the rise. Buyers see some market opportunity as do sellers.
A slight dip in cash sales might suggest low interest rates drew more buyers towards traditional loans, but it is too early to tell. If buyers in the luxury $1.2MM+ band are in fact coming out to find opportunities to invest, then we may see support for this level of cash buying activity going into the spring and summer. Also, we are likely going to have interest rates closer to 7% going into spring add on slowly rising inventory and we may see some prices go down to attract opportunistic buyers (See below).
Please note that in the cash vs. loan chart above, I am including non-traditional financing such as private lending, owner will carry (OWC), wealth management based borrowing options and 1031 Exchanges to name just a few. We also cannot see exactly how much cash is being used in the “loan” purchases. Many high-net-worth buyers that are looking to buy homes in the upper two market bands may be paying well over the normal 20% for their down payment and they could also be paying points to reduce their interest rate. Cash is still a major factor for our market even if a traditional loan is involved.
Inventory is rising. It’s not quite a balanced market as there is heavy favoritism for the buyer’s side. More inventory means more choice and with that comes price competition and the ability for buyers to negotiate a better deal.
Let’s unpack what this all means for the near term. We are in a buyer’s market, but traditionally Lake Las Vegas has always had over 5 or 6 months of inventory. This is true across all market bands though traditionally, the $1.2MM+ band tends to take longer to sell due to the limited buyer pool. This is a long way to say that this is normal for this market. Lake Las Vegas homes tend to sell for about $100 more per square foot than the average for the entire Las Vegas market area, which is generally why our inventory takes a bit longer to sell. When you see that we are in a “Buyer’s Market” on the gauge chart above, you should not immediately assume that buyers are in command of the market, but neither are sellers. This is closer to a balanced market than you think. Most owners have plenty of equity and most of the outstanding mortgages these days, nationally and regionally carry much less risk than they did before 2008. So if you are a buyer waiting for distressed properties to hit the market at fire sale prices, I’m here to disappoint you. Yes, there may be a few opportunities here and there, but that is normal in any year. If there are homeowners who are struggling financially, they likely have plenty of home equity they can tap into to cover their immediate cash needs, so they have no reason to sell at fire sale prices. If you want a better way to imagine what the seller’s position is, understand that although prices have softened in recent months, they are still well above 2019 levels. It’s as if we were driving 120mph, saw a police car up ahead and slowed down to 105mph. You’re still getting pulled over and you’re still getting a ticket buster.
What Lake Las Vegas is seeing inventory wise is partly due to the fact that so few homes sold in the second half of 2022 that we have excess inventory plus new listings. New listings are to be expected in the spring. People who track interest rates, bond markets, mortgage backed securities and such are planning on more rate hikes. But because Lake Las Vegas attracts a lot of cash capable high-net-worth buyers those buyers don’t have to care too much about mortgage interest rates. Those buyers are also more likely to invest in residential real estate. In fact, according to the 2023 Knight Frank Wealth Report Pulse Survey of high-net-worth individuals globally, residential real estate ranks at the top of the list for investments that they consider “safest and least volatile,” which puts it above even gold as an investment. A home doesn’t need to be priced excessively low to be attractive to these types of buyers. Residential real estate investment is always a long term game. Prices are localized so homes in L.A. are more expensive than Las Vegas, which means buyers from more expensive markets usually have more ability to buy homes in our relatively lower priced market. Keep in mind that the Las Vegas/Henderson area is in the top 20 for international buyer traffic according to Realtor.com. We are also attracting nearly 30% of the potential Los Angeles, CA County based buyer pool. These buyers may be trying to escape recent “mansion tax” laws or perhaps are looking for a way to simply upsize without having to pay the L.A. premium.
The buyers are out there. Lake Las Vegas is an attractive location due to our unique features, resort amenities, and relatively balanced real estate market. In the short to medium term, prices are not going to grow at the same pace they were in 2021 and early 2022. In the long term however, they will continue to grow due to the nature of our buyer pool.
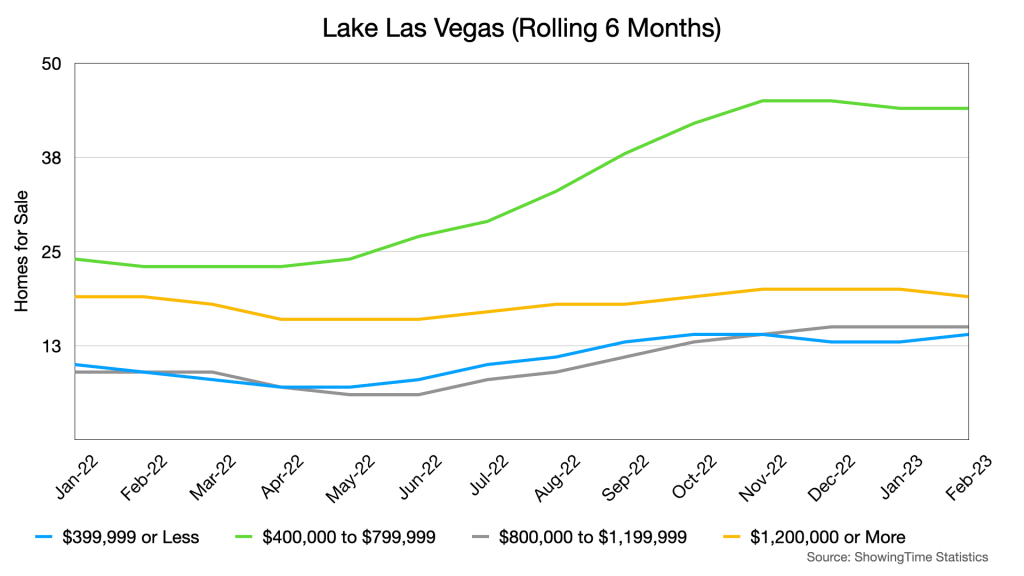
So we return to our banded breakdown. We have one category that is growing more than others in terms of inventory and that is the second band, $400k-$799k. It is worth digging a bit deeper, so I broke this band down into smaller bands below.
While each sub-band had some kind of increase in listings, by far, the biggest jump comes in the $500k-$599k band with a little jump for the $600k band as well. There is a reason for this. The green line represents the average price point for much of the builder listed inventory. Approximately half of the listings in the green band are builder inventory or condos. There are many reasons why a builder may want to build inventory homes, but often it is to simply turn inventory in a slower market or to have move-in-ready properties available to entice buyers who are reluctant to wait a long time during an uncertain economic cycle. Some inventory could be on the MLS because the deal fell through during construction. The inventory they list is selling, so I don’t think this says all that much about housing demand in general, but I’ve got my eye on it.
For more Lake Las Vegas real estate market data, click on the button below to access our dashboard.
Inventory is still outpacing buyer demand and has extended its lead. The latest interest rate spike has slowed the pace of mortgage (purchase) applications lately which might cool off some loan reliant buyer activity, but many of them are also learning how to navigate the interest rate situation a bit better. Incentives from sellers are making it easier for for buyers to buy down points. Cooperation is better for the market than pure adversarial competition as long as both parties respect each other’s need to get an optimal outcome. In this world, an optimal outcome is a closed deal that captures a reasonable net for the seller, which isn’t hard to get given how much appreciation there is still in this market, and the buyer needs to get the home they want for a price they are willing and able to afford. The more buyers study the landscape and talk to their real estate and mortgage professionals about options, the more they will become comfortable with making a creative choice. Buying a home at current rates leaves open the possibility of refinancing when rates inevitably go down at the end of the Fed’s quest to wrangle inflation. Buying cash offers a similar future refinance opportunity so that the buyer can reinvest that cash when other investment opportunities arise in the future.
Inventory is selling. Buyers are looking. Increased inventory doesn’t necessarily mean massive price reductions. Sellers are still getting around 95% of list price. Some seller’s may have overpriced their homes assuming low inventory would support their price and certainly there is room to negotiate or wait for the prices to drop, but most sellers are becoming realistic about the market and their agents have more and more comps to set a realistic price. Some of the inventory we are seeing is coming from builders and it competes with other resale so sellers that have comparable homes may need to be aware of that competition.
We invite you to leave your thoughts in the comments below.
Before we get into it, I’d like to thank you for following our market reports. These reports serve two purposes. They are intended to keep you informed, but they also serve as a way for me to digest the information I am tracking on a regular basis. Not all of the news and information ends up in this report, but it is nonetheless baked into the opinions and thoughts expressed. For me, writing this report helps me figure out what information is important and what is just noise. I hope it helps in how you think about real estate data in general.
Now, onto the matter at hand. In the January report, we had identified some potential emerging trends in the market. Those trends include some early indicators of buyer confidence as well as seller confidence. Before we dig into the numbers, I would like to remind you that the real estate market is seasonal. Listing and selling activity usually picks up in the spring and summer months and cools down for the winter and fall months. We are still in the trailing weeks of winter so it’s a bit early to draw conclusions as to how the spring market is going to turn out, but we do have some idea of the direction it is headed. As of now, we think it is headed for a moderately active buying season, but there are indicators that inventory may offset the uptick in buying activity. Here is where things stand today.
Lake Las Vegas by the Numbers
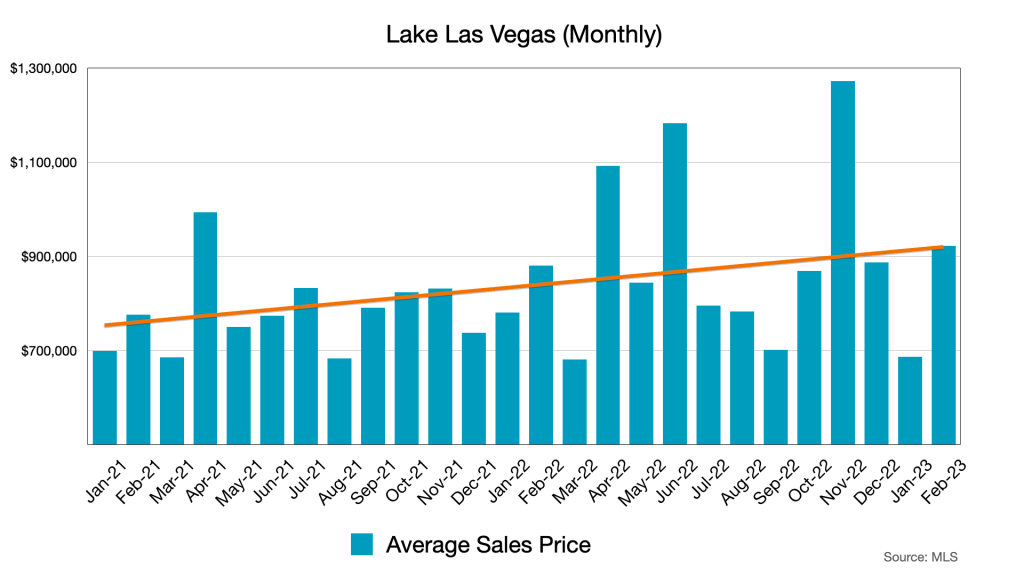
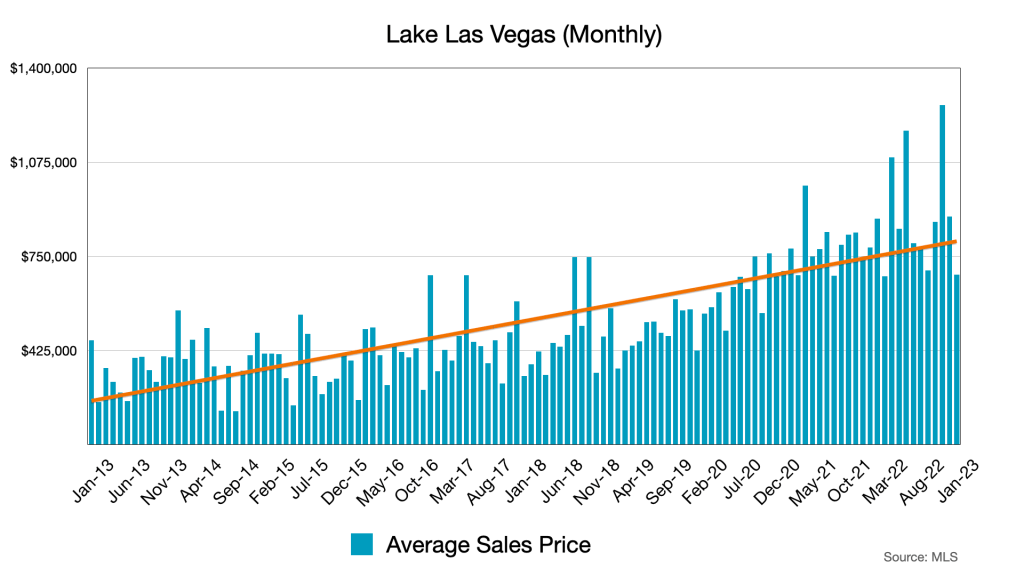
First some long term perspective for context. This is ten years worth of Lake Las Vegas sales data, which you can explore here. The orange line is just a linear trend line. The point is, that most homes in Lake Las Vegas have seen significant gains so the softening that happened in the latter half of 2022 had little impact on those gains.
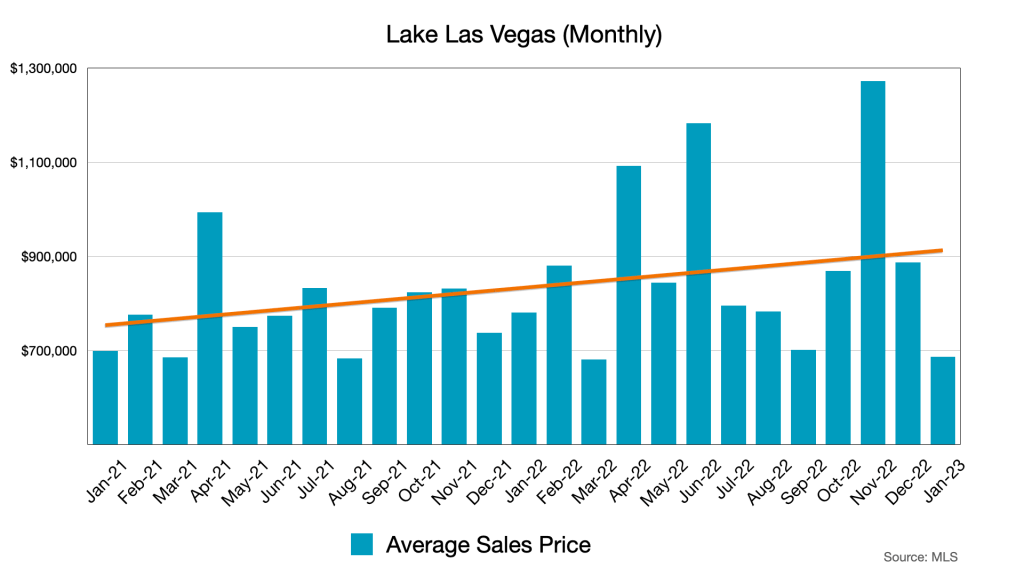
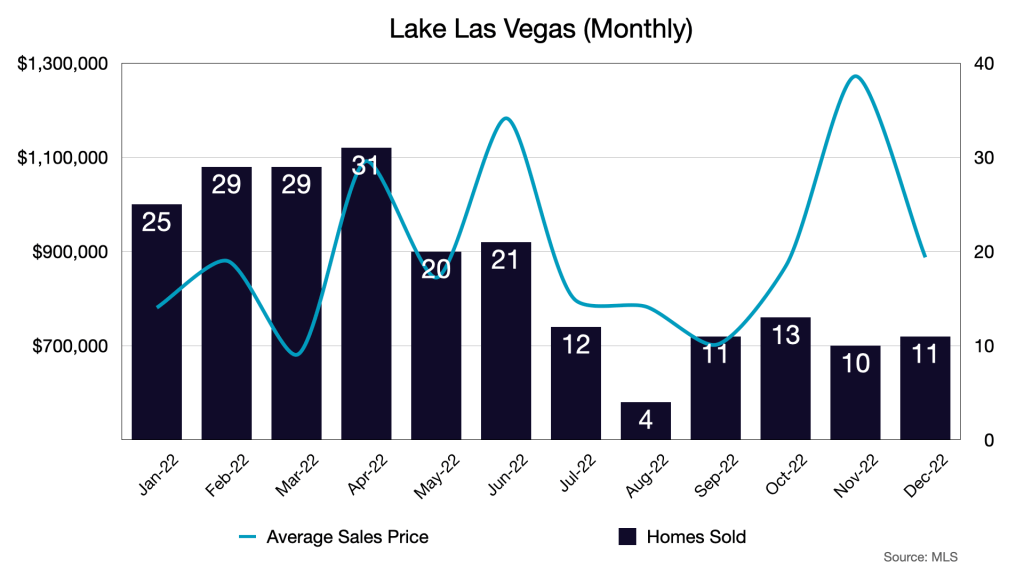
If we zoom into 2021, 2022 and January 2023, you can see that we are still on an upward trajectory in terms of price. Note that the second half of 2022 had considerably lower number of sales. November of 2022 is an anomaly because there were a few high dollar value closings that month that skewed the average. You can explore this data in greater detail on our Dashboard so you can see which transactions included in these averages.
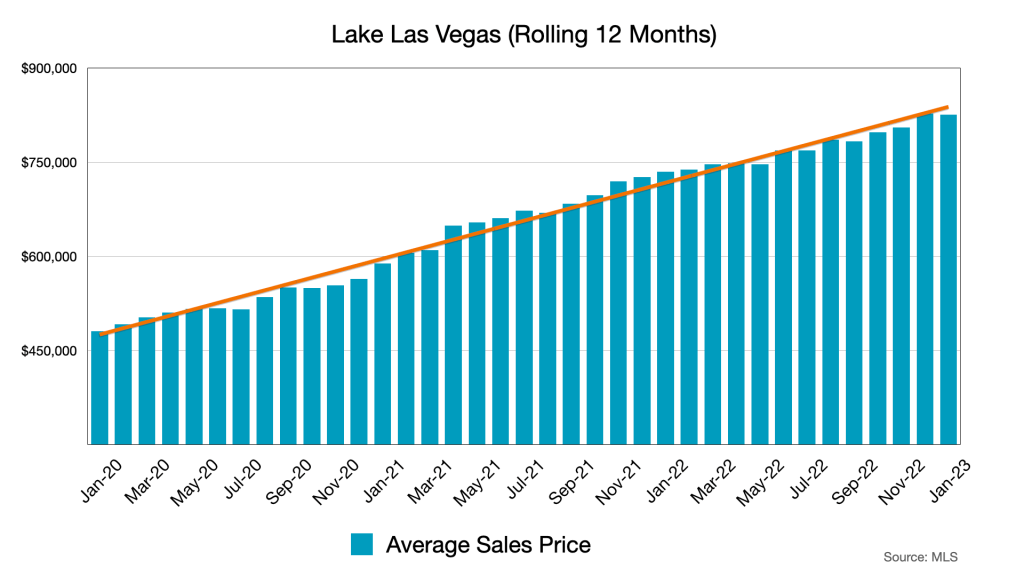
Here we see the average sales price as a rolling 12 month average. This helps reduce the effects of seasonality and unusually large or small sales prices.
It takes about 30 to 45 days to close most sales. Yes, cash sales can close faster, but often do not due to the logistics of the seller’s or buyer’s move and other factors. Here we see transactions that closed in January 2023 going up slightly, which means those homes went under contract in November or December. Mortgage (purchase) applications bottomed by the end of October 2022 and began to rise in November. This is a national number, but it does track with the bump in sales activity that we are seeing today.
January 2023 had the highest pending sales number since the sudden drop off in April 2022.
But new listings are part of the inventory equation as well. New listings in this case, suggests seller confidence. At this point in time, there are no extreme economic factors that are forcing people to sell. These are sellers who still have a lot of equity built up and feel reasonably confident they will be able to sell at an acceptable price. Sellers are also buyers in most cases, because people have to live somewhere.
Here is where we are today in terms of inventory. This simply means that assuming no more homes come onto the market, the current inventory will be sold off in about 6 months assuming they keep selling at the current pace. Of course, we should expect new inventory and fluctuations in the pace of selling, but this tells us that we are still in a healthy market even though for now, listings seem to be out pacing buyer demand by a bit.
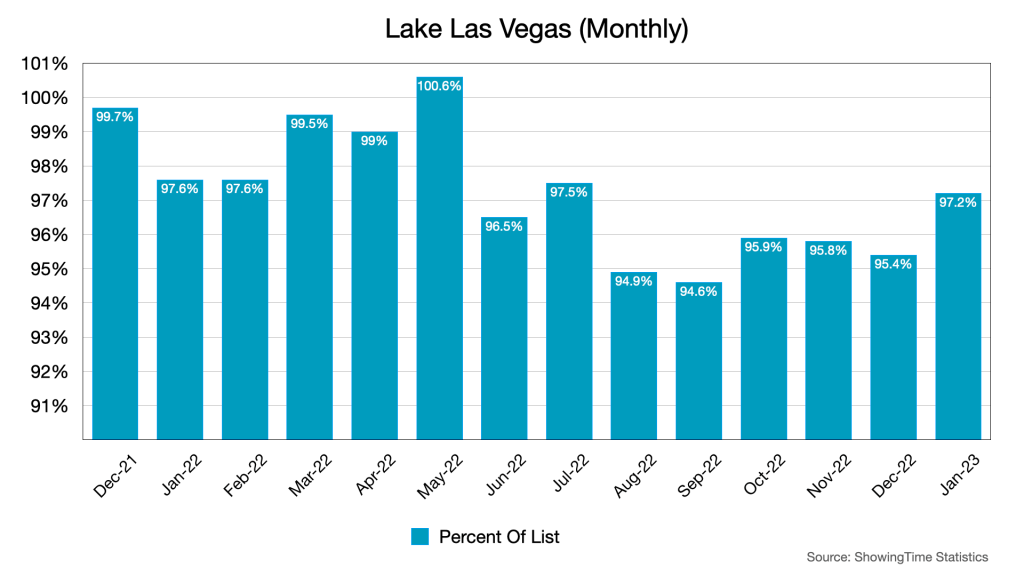
Here is some good news. We’ve broken above the 95% mark in January. So on top of more homes selling and going into contract, we are also seeing offers that are closer to list. One word of caution though, this is one month of data and it is still a relatively low number of sales we are looking at. This suggests two things. One, list prices have adapted to the new market. We have better comps out there to inform us how much a home ought to sell for so we are getting it closer to reality now. Two, buyers have access to those same comps and feel comfortable accepting a counter offer knowing they are getting a fair price.
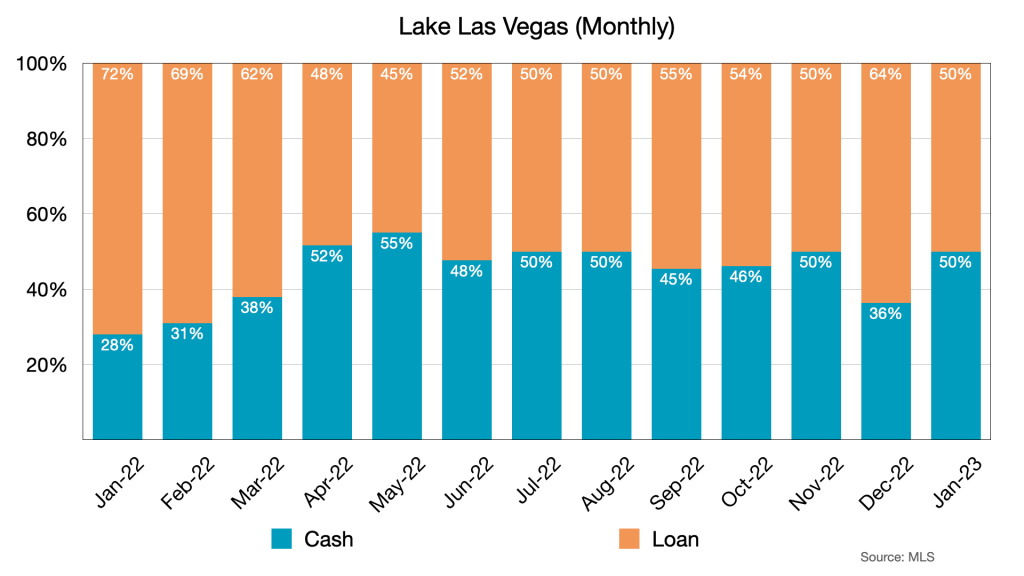
Cash buyers are still a significant portion of the market. Despite a recent Fed rate hike, interest rates have come down and seem to be stabilizing in the low 6% and in some cases the mid to high 5% range. Interest rate stability is an important factor for buyer confidence. We are already seeing another bump in mortgage (purchase) applications similar to the one we had in November.
For more Lake Las Vegas real estate market data, click on the button below to access our dashboard.
January 2023 represents a healthy rebound from the doldrums of the latter half of 2022. The spring market will likely bring more buyers and sellers into the market. Home prices will likely remain stable in the coming months.
We are watching two national level stats, interest rates and mortgage (purchase) application data to see how many potential buyers are coming into the market in the 30 – 90 days following the data. To get a good grip on interest rates, we follow two other indicators, the 10 Year Treasury note yield and the price of mortgage backed securities (MBS). When the MBS market is weak, lenders tend to raise interest rates and conversely, when they are strong, they tend to lower interest rates.
The big picture economic indicators like employment, GDP, debt and inflation tend to be less reliable for knowing where a highly localized housing market like Lake Las Vegas is headed, but nonetheless, they impact national and often international markets so they are still important to watch. One of the reasons I am tracking the cash vs. loan buyers is because cash buyers tend to be people who have enough accumulated wealth and income to weather these larger economic storms when they happen. They are often the first buyers to come into the real estate market when opportunity presents itself. In my opinion, the recent softening of home prices, a balanced 6 months of inventory and indicators that the local market has stabilized from the 2022 slowdown all represent potential opportunity for cash buyers. Keep in mind that according to the Credit Suisse Global Wealth Databook, global personal wealth grew 13% last year, and is projected to keep growing through 2026. This means that the number of cash capable buyers is growing.
With the above global trends in the growth of high net worth individuals in mind, we have to also remember that strong tourist demand and a quality tourism board often correlate to a strong inflow of potential high-net-worth international buyers. Las Vegas is a popular tourist destination and Lake Las Vegas has all of the important ingredients many of these buyers are looking for.
I invite you to leave your thoughts in the comments below.
This is your one-stop shop to keep tabs on the real estate world. Our exclusive Lake Las Vegas Market report will be delivered directly to your inbox, no need to go looking for it on Facebook. In addition, you will receive local news, events and information that we have compiled. And since real estate is also global, we will be providing articles, insights, news and about global real estate.
We entered 2022 hot so it feels like we are leaving it cold. That is how rapid shifts affect us psychologically. If you’ve been sitting in a hot tub for an hour and you get out you might think it’s freezing cold outside, when it’s a relatively warm 93F. The same holds for the real estate market in the last year.
At the beginning of 2022, we had 2 months of inventory, which is the second lowest level reached for Lake Las Vegas in a decade, only bested by May of 2021. From there it just kept going down… until the Fed raised interest rates. Buyers stopped looking. Phones stopped ringing. It seemed like a real estate apocalypse out there. But the essential economics of the market didn’t change. By December 2022 the average home price for all of Lake Las Vegas had risen over 25% since the beginning of 2021. At the beginning of 2022, buyers were experiencing FOMO (Fear Of Missing Out). They were afraid that someone with more buying power would out-bid them on a home so they were making above list offers, and/or removing important contingencies. Suddenly, mortgage interest rates spiked and buying power was deflated. Already exhausted buyers just quit. Some buyers already had to stretch well beyond their comfort zone to budget for a home purchase, rapidly growing mortgage rates pushed them well past their acceptable budget. It didn’t help that the stock market had tumbled on several occasions and inflation didn’t seem to slow down. Buyer’s got the signal, they suddenly understood that there is no reason to rush into a purchase and plenty of reason to wait for the market to bottom.
Robin and I have a live feed of real estate activity here in Lake Las Vegas. Every new listing, listing put under contract, price reduction or closing hits our radar the second it it is pushed to the MLS. We saw price reductions at first, followed by withdrawn listings, or listings that were put up for rent. Inventory piled up, but mostly because homes were not selling. New listings were not coming online very often, in fact, they had slowed down. So where are we now, and where are we headed? Let’s review where we are now first.
Lake Las Vegas by the Numbers
We broke the downward trend in sales activity, which bottomed out in August, but we still ended the year quite low. Keep in mind that the winter months tend to be slower in general. Please note that some of the average price volatility may be due to this low sales volume.
Although considerably fewer new listings came on the market in the second half of 2022, inventory began to pile up due to the slowdown in sales volume. We are starting to see more sales activity and the reduction in inventory towards the end of 2022 may be the start of a trend, though we may not see this accelerate until the spring when market activity usually picks up.
At the beginning of 2022, Lake Las Vegas was in a strong seller’s market with less than 3 months of inventory. We peaked in November at 6.9 and the recent sales uptick has brought us back to a balanced 6 months of inventory.
Pending Sales is a forward looking indicator. Most pending sales close within 30 – 45 days of acceptance. We should see another reduction in inventory assuming listing activity does not grow faster than sales.
The shift away from a seller’s market can be shown in the offers. Accepted offers have been about 4% lower than list for the second half of 2022.
From 2009 to 2018, the Lake Las Vegas market was dominated by cash buyers with a peak of 76% of transactions being in cash*. The low interest rates of the latter years enticed some of those cash buyers to consider taking a low interest loan so they didn’t have to take too much out of their portfolio to buy a home. With rates going up, we are starting to see more cash entering the market. We’ll continue to watch this to see if it becomes a trend or if this is just normal variance.
*Cash transactions include non-institutional lending arrangements and other non-traditional transactions, such as Owner Will Carry, 1031 Exchange, Private Lending, Wealth Management Leveraged Accounts and other such arrangements.
For more Lake Las Vegas real estate market data, click on the button below to access our dashboard.
As of this writing (1/19/23) there are 24 new listings that hit the market in January making the total active listings 101. So far, 12 listings have gone under contract in January and 4 have closed. This upswing in listing activity suggests sellers are feeling confident in the new year and although pending contracts isn’t quite keeping up pace with listings, it is still a lot more active than in previous months, which suggests buyers are also feeling more confident going into 2023.
Interest rates have pushed some buyers out of the market, or down market. Cash capable buyers too, no longer have the leverage of an institutional loan they might have had in previous years to increase their buying power. The massive losses in the stock market in the early and middle parts of 2022 likely postponed cash or cash heavy purchases. If market confidence continues to improve, we may see an uptick in sales activity in spring and summer 2023.
Cash buyers are returning to the market, albeit at a slow pace. They may need time to get comfortable with the new reality and to realign their portfolios to ensure they can make a purchase comfortably. Non-institutional lending will replace some of the institutional borrowing that wealthy cash capable buyers might have used because they are now competitive with institutional loans.
We are tracking mortgage rates regularly to see where they are headed. If we see them stabilize or better yet, drop into the 5% range, we think this will add to buyer confidence. Unless some other economic conditions force home owners to sell at a discount, it is unlikely that inventory is going to increase significantly, which means home prices will remain stable, or at least they won’t drop significantly. In short, we are in a balanced market and there is little reason to believe it will swing one way or the other. A balanced market is a healthy market. Seller’s can take advantage of the growth they saw in the past few years, and buyers have some room to negotiate given the slowed pace of sales.
I invite you to leave your thoughts in the comments below.